https://ift.tt/ubh3NZr A comprehensive guide to handling missing data using Pandas Photo by Pierre Bamin on Unsplash Missing data val...
A comprehensive guide to handling missing data using Pandas

Missing data values are almost inevitable in every real-world dataset and practically impossible to avoid in typical data gathering processes.
This can occur for various reasons, such as errors during data entry, issues on the technical front in the data collection process, lost/corrupt files, and many other reasons.
In any real-world dataset, there is usually some missing data that Data Scientists and Machine Learning Engineers have to deal with, otherwise, it can potentially lead to several problems in developing the data pipeline.

Therefore, in this post, I will demonstrate a handful of techniques you can use to handle missing data in your data-driven project and possibly eliminate the problems missing data could have caused while building the data pipeline.
The highlight of the article is as follows:
· Why You Should Handle Missing Data
· Handling Missing Data
· #1 Keep the Missing Data
· #2 Drop the Missing Data
· #3 Fill the Missing Data
· Conclusion
Let’s begin 🚀!
Why You Should Handle Missing Data
Before proceeding to HOW to solve the problem, it is essential to understand WHY it is necessary to handle missing data in the first place.
Data is indeed the primary driving fuel of all data science and machine learning projects. It is the core element of all projects that the machine will base all its decisions on.
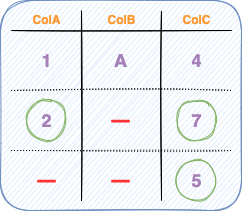
While the presence of missing data can truly be frustrating, its outright elimination from the dataset may not always be the right way to proceed. For instance, consider the image below.

If you consider eliminating all the rows which have at least one missing value, it:
#1 Reduces the number of data points in the dataset
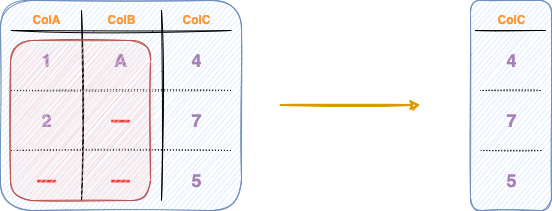
As shown in the figure below, an outright rejection of rows containing any missing values significantly reduces the number of rows in the dataset.

#2 Leads to a loss of other valuable (and correct) information we already have

For instance, in the DataFrame above, even though the value of ColB in the middle row was unobserved, we still precisely know the corresponding values in colA and colB, which can still be extremely valuable to the data pipeline.
Handling Missing Data
Now that you have understood why you should handle missing data, let’s understand the technical aspects of dealing with missing data.
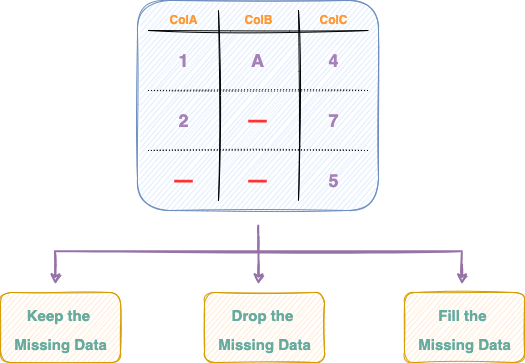
Whenever you encounter missing values in your tabular data, you basically have just three options to choose from, as illustrated in the image below:

Let’s discuss these three methods in detail below.
#1 Keep the Missing Data
As the name suggests, this method absolutely ignores the presence of any missing data points in your dataset.
The dataset transformation method, in this case, returns a copy of the original dataset, as shown in the image below:

Here, however, it is inherently assumed that missing data points won’t cause any trouble in the data pipeline and the methods leveraged are adept at handling missing data.
Therefore, it is the Data Scientist’s or Machine Learning Engineer’s job to decide if their algorithm can work if the missing data is left as is.
The method for keeping the missing data untouched is defined below. We define the function handle_missing_data() which takes the source DataFrame as an argument and returns it without transforming.
As shown in the implementation above, the original DataFrame remains unaltered.
#2 Drop the Missing Data
Next, imagine that keeping missing data, as discussed above, isn’t feasible for your specific use-case.
In that case, dropping the missing data altogether may be a direction to proceed.
The broad idea here is to remove the entire row (or a column if your use-case demands series-based analysis) from the DataFrame which had any missing value.
In other words, in this technique, you keep only those rows (or columns) of the data which have a non-null value corresponding to every column (or row) and treat the dataset as if the deleted row never existed.
Row-wise dropping
As the name suggests, the objective here is to drop rows of the DataFrame that contain missing values.
The row-wise dropping is depicted in the figure below.

The number of columns remains the same in row-oriented dropping.
Column-wise dropping
In contrast to row-wise dropping, column-wise dropping involves eliminating columns (or series) of a DataFrame that contain missing values.

The number of rows remains the same in row-oriented dropping.
Implementation
Similar to the strategy discussed above on keeping the missing data, next, we will implement the handle_missing_data() function to drop rows (or columns) from the DataFrame with missing values.
You can drop rows from a DataFrame using the dropna() method as shown below:
The axis argument specifies the orientation (row-wise or column-wise) across which you want to drop the missing values from the DataFrame.
- axis=0 performs row-oriented dropping. This is demonstrated below:
- axis=1 performs column-oriented dropping as shown in the code block below:
#3 Fill the Missing Data
The final technique involves filling up the missing data with some value that could be the best-estimated guess for the given unobserved position, as shown below.

The strategy can involve filling up the missing data with the average value of the column, the median value, or the most frequent value (mode) of the column — depending upon the type of values in the column.
This is because Mean, Median, and Mode can be estimated only for numerical values. However, in the case of a categorical column, mean and median hold no meaning.
Moreover, the filling criteria entirely depends upon your particular data source, the problem you are solving, and how comfortable you feel evaluating that particular missing data point.
Implementation
Among the most commonly used techniques to find the best-estimated guess for missing values are Mean, Median, and Mode, which are demonstrated below:
- Filling with Mean:
The mean strategy replaces the missing values with the average of the column.
As discussed above, the mean strategy did not replace any missing values in colB.
- Filling with Median:
Next, the median strategy replaces the missing values in the column with the median. This is implemented below:
Once again, the values initially missing from colB are still filled with NaN values.
- Filling with Mode:
Lastly, filling with the mode value substitutes the missing values with the most frequent value of the column, as shown below:
You can also apply different filling strategies to different columns, as demonstrated below:
Here, we fill the missing values in colA with the mean of colA and that with the mode in colB.
Conclusion
To conclude, in this post, I demonstrated how to deal with missing data in your Pandas DataFrame. Specifically, we looked at why handling missing data is essential to your data pipeline, followed by commonly used strategies to deal with missing data.
While dealing with missing data, you should keep in mind that there is no correct approach among the three methods we discussed in this post (Keep, Drop, and Fill). This is because each case is different.
As the situation demands, it will always be up to you to decide which specific method to choose.
Thanks for reading!
✉️ Sign-up to my Email list to never miss another article on data science guides, tricks and tips, Machine Learning, SQL, Python, and more. Medium will deliver my next articles right to your inbox.
Why You Should Handle Missing Data and Here’s How To Do It was originally published in Towards Data Science on Medium, where people are continuing the conversation by highlighting and responding to this story.
from Towards Data Science - Medium https://ift.tt/t4fTuId
via RiYo Analytics

No comments