https://ift.tt/3EBWCn9 A quick introduction to the declination angle and how it can be a powerful tool for detecting gerrymandering Each p...
A quick introduction to the declination angle and how it can be a powerful tool for detecting gerrymandering
Each problem that I solved became a rule which served afterward to solve other problems. — Rene Descartes

If you’ve read the news lately, you’re likely aware that states are redistricting, a decennial process where political boundaries are redrawn to reflect demographic change. And if you’re empirically minded, you might reasonably ask if there’s some quantitative measure to characterize the degree of harm. Is there a mathematical line in the sand where a plan’s bias becomes a legal issue?
In this post we will discuss a tool, called the declination angle, which helps us address these questions. A geometric concept widely used in astronomy and physics, it was recently introduced as a heuristic in the redistricting context by Professor Greg Warrington at the University of Vermont. There are a handful of empirical methods that probe at this sort of thing, but I believe this is particularly interesting heuristic in a vote dilution context. It’s elegant, intuitive and convenient.
But before we get to the math, let’s quickly discuss the law. Ultimately, our authority here is the Voting Rights Act of 1965 — which, among other things, prohibits vote dilution.
Vote dilution is about intentionally diminishing the power of a minority group to influence elections. It can take two forms: packing or cracking. Both tactics effectively insulate the party-in-power from competition, and prevent meaningful representation for communities on the margins.
The schemes do what they sound like they do. Packing means to pack as many minorities into a district as one can — often to the point where the group constitutes 60% or more of the overall voting population. The idea is that, while that district becomes lopsided in favor of the minority group, the broader plan favors the majority by preventing communities near the boundaries from unwelcome influence in adjacent districts. South Carolina’s 6th Congressional district, represented by Congressman James Clyburn, is an example of packing black voters.
Cracking inverts the idea. Rather than concentrate the group into a district, cracking searches for a critical mass of minorities on the map cracks them — dividing an otherwise cohesive community amongst a number of districts. In none of the districts are they large enough to be competitive. Birmingham and Austin are examples of cracking in their respective Congressional maps.
Declination angle quantifies these phenomena. Plotting the districts of the plan along the x axis, we are able to view the percentage Democratic votes in each respective district. Naturally, some districts have a very low population, while others have a significant presence. As you move from left to right, as the population increases, one would expect there to be an inflection point. At that point, we find an upward breaking angle as the districts change from being controlled by the party in power to those controlled by the opposing party. The angle tracks the demographic percentage; it breaks due to the high correlation between race and party affiliation (this correlation makes the calculation possible).
Yet the degree of break is where we find insight. Dr. Warrington studied VRA-challenged districts across the country and found that the severity of the angle corresponds directly with the severity of the gerrymander. As packing becomes more pronounced, the declination angle increases.
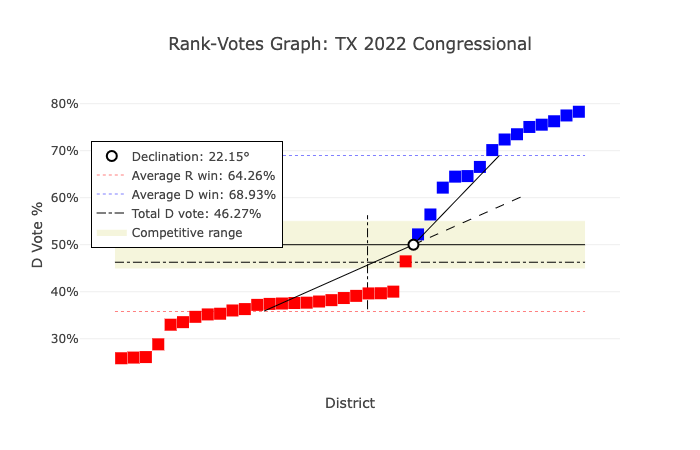
This week my home state of Texas was sued by the Department of Justice for racially gerrymandering. We can see a declination angle of 22.05% for the U.S. House of Representatives plan above. The angle is created after the second to last Republican district near the middle of the X axis.
One of the revealing properties of the plot is how the red Republican districts plateau with Democratic vote share in the high 30’s; the curve gets to that point quickly, then flattens out and stays there as long as possible. This is indicative of the intentionality of the map’s design.
To return to packing and cracking, the packed districts are furthest to the right on the x axis. Generally, the upper bound for a majority share of a district is somewhere in the mid 60s; this is not a hard and fast rule, but when you get into the game 70s it starts raising eyebrows. Nearly half of the Democratic seats are above that threshold.
Lastly, how can we implement this method to maps we encounter? There are a couple of great apps that do this for you without code. I produced the plot above with Dave’s Redistricting app which is a fantastic resource. The Campaign Legal Center provides declination calculation with its app, PlanScore. Both are free!
import numpy as np
import math
def calculate_declination_angle(dem_vote_share):
   majority_wins = sorted(filter(lambda x: x <= 0.5, dem_vote_share))
   minority_wins = sorted(filter(lambda x: x > 0.5,
dem_vote_share))
   theta = np.arctan((1 - 2 * np.mean(majority_wins)) * len(dem_vote_share) / len(majority_wins))
   gamma = np.arctan((2 * np.mean(minority_wins)-1) * len(dem_vote_share) / len(minority_wins))
   declination_angle = 2 * (gamma - theta) / np.pi
   return declination_angle
If you are manipulating shapefiles, or otherwise analyzing maps with code, you can also use this Python function in the snippet above. Simply pass it a list of the Democratic vote share (over a single, or a group of elections) in each district, as float values. It returns the calculation as a scalar value. As I shared, it’s a quick and easy calculation you can integrate into your workflow.
We should understand this as a diagnostic tool, not definitive proof of liability. A proper analysis would incorporate a richer data set — and, of course, the guidance of an experienced voting rights attorney. As the saying goes, all models are wrong, but some are useful.
I hope this was educational. I also hope that this is inspiring. We live in an age with better tools; we should use them to demand better representation.
Detecting and Measuring Gerrymandering with Python was originally published in Towards Data Science on Medium, where people are continuing the conversation by highlighting and responding to this story.
from Towards Data Science - Medium https://ift.tt/31OxACU
via RiYo Analytics


No comments