https://ift.tt/2YwafEG Learn how consumer data can be used to optimize sales and marketing strategies Photo by SHVETS production from P...
Learn how consumer data can be used to optimize sales and marketing strategies

Let’s say that you work with the sales and marketing team to reach your company’s pre-set goals.
While your company is doing well in terms of generating revenue and retaining customers, you can not help but think that it can do better.
As things stand, the advertisements, promotions, and special offers are homogenous across all customers, which is a serious issue. Engaging with customers in a manner that they won’t be receptive to is tantamount to wasting your advertising budget.
After all, you don’t want your company to spend its limited budget sending diaper coupons to college students or advertising gaming consoles to elderly women.
What you do want is to customize your approach towards every type of customer to make the most out of your marketing investments.
This begs the question: how do you properly distinguish between the people in your consumer population?
This is where clustering comes to play.
With the consumer data that your company has painstakingly collected, you have the means to perform a cluster analysis to divide your consumers into appropriate groups and customize your marketing strategy for each group.
With an approach that is tailored towards different types of customers, you will be able to reap the most benefits from your investments in advertisements and promotions.
Here, you will gain more insight into how data science can help businesses segment their consumer population.
In the following case study, the k-means clustering algorithm will be used to find the optimal way to divide customers into groups.
Case Study
The objective is to use customer data to figure out how to divide the consumer population into the ideal group of clusters.
The data (copyright-free) can be accessed here.
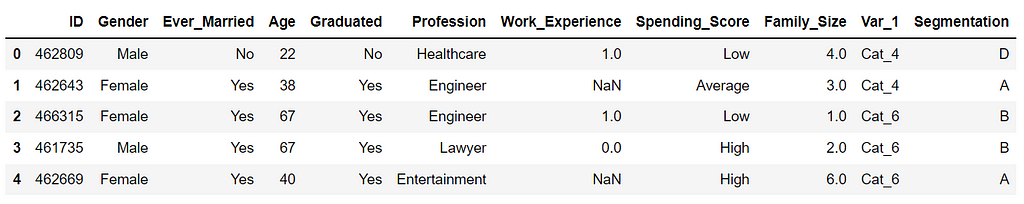
The preview of the dataset below shows the information provided for each customer.
Data Preprocessing
We preprocess the dataset so that it can be inputted into the clustering algorithm. This entails:
- removing unwanted features
- removing missing values
- removing outliers
- encoding categorical features
After that, the data will undergo normalization and a principal component analysis (PCA). Normalizing the data ensures that the machine learning model is not biased towards any of the features, whereas a PCA will reduce the dimensionality of the dataset to mitigate overfitting.
Building The Clustering Model
Next, we need to determine the ideal number of clusters for this batch of consumers. This can be easily determined with the elbow method.
While the elbow method can be performed manually, it is made a lot simpler with the yellowbrick library, which can build the visual plot with a single line of code.
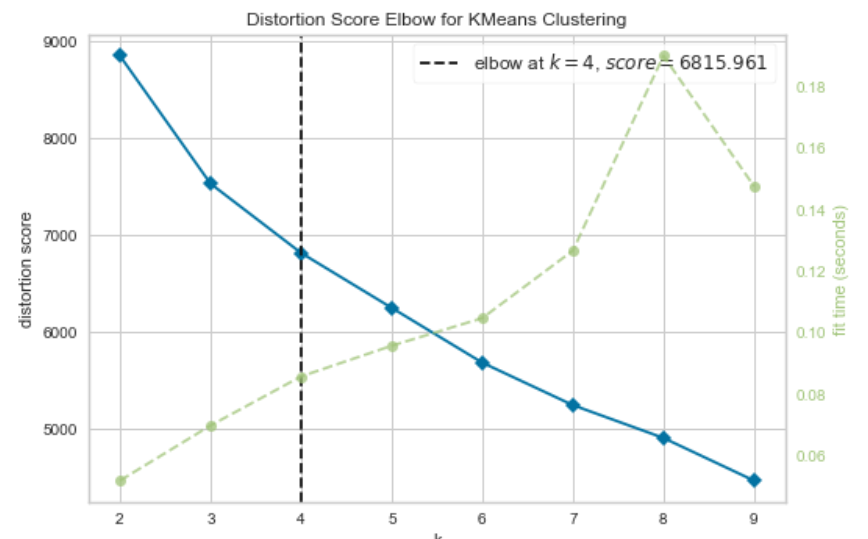
The elbow method suggests that it will be ideal to divide our consumer population into four groups.
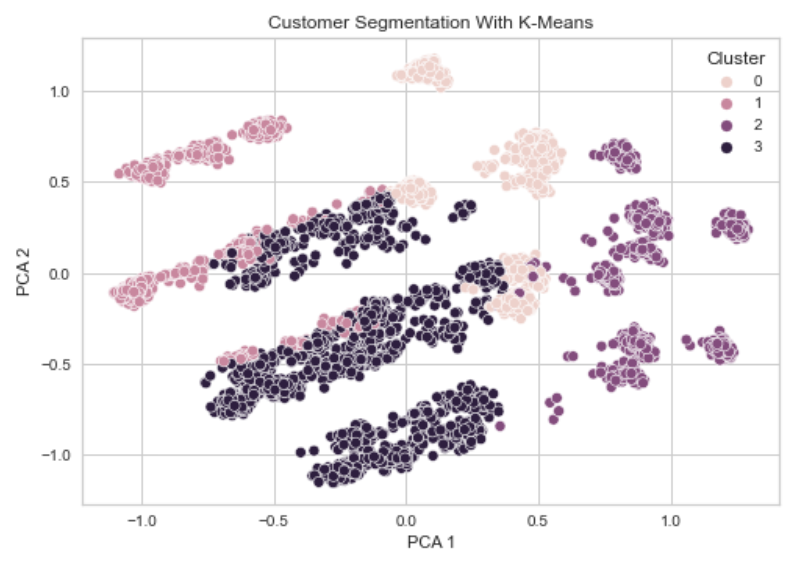
Let’s create a k-means clustering model that assigns each customer to one of four clusters.
To visualize the results of the clustering, we can develop a scatter plot.
The coordinates of the points representing the customers will be based on the first two PCA components.
Interpretation

At this point, you may be tempted to pat yourself on the back, but the job hasn’t been done yet.
Ask yourself: what have you really learned at this point?
Even though you have separated your consumers into groups, does the manner of the grouping even have any meaning?
If you can not explain the clusters formed by your algorithm, all your efforts are fruitless. For the people you present your findings to, a group of clusters with no well-defined traits is no different from a group of clusters made at random.
The cluster analysis will only have significance if you can explain how your customers are divided. This will allow you to understand each group and then plan a marketing strategy for each group accordingly.
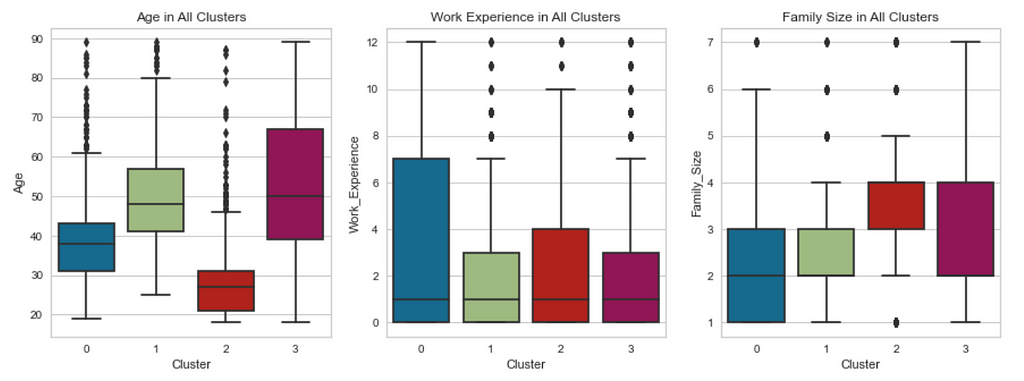
We can use box plots to compare each cluster in terms of age, work experience, and family size.
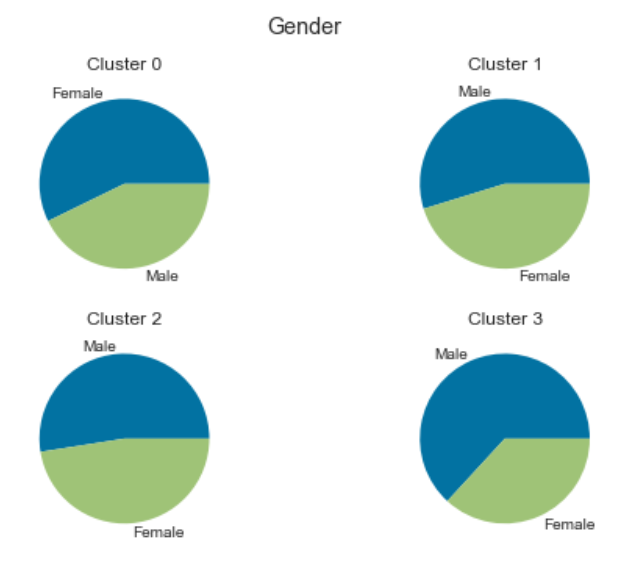
We can use pie charts to compare each cluster in terms of gender, marital status, graduation status, profession, and spending score.
For convenience, we can create a function that generates pie charts comparing clusters in terms the given feature.
The pie charts comparing the clusters are shown below.
Gender:
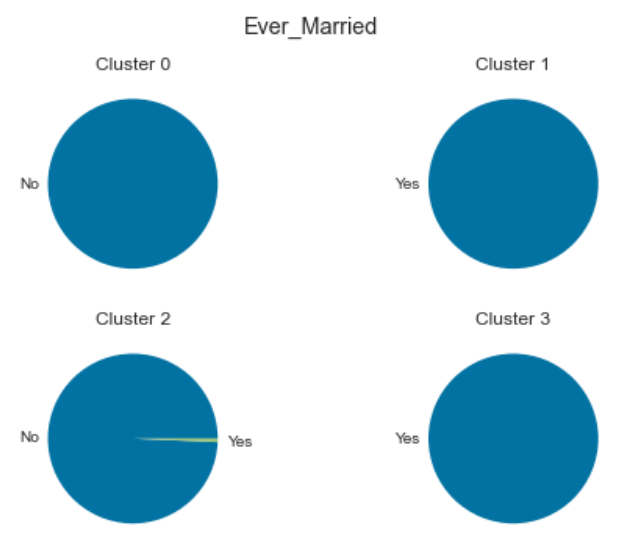
Marital Status:
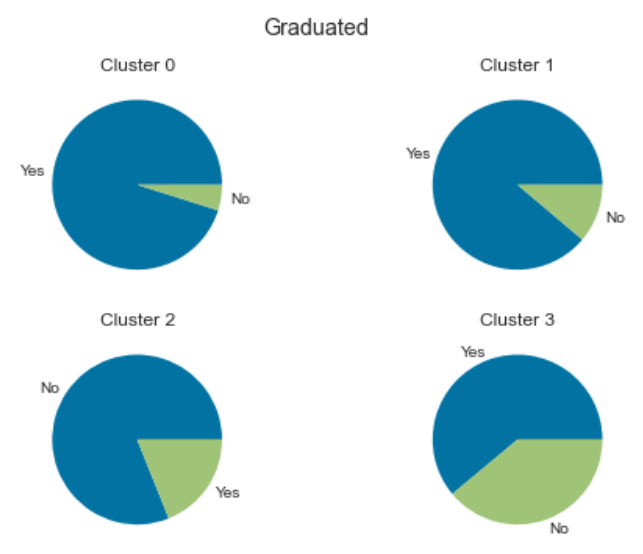
Graduation Status:
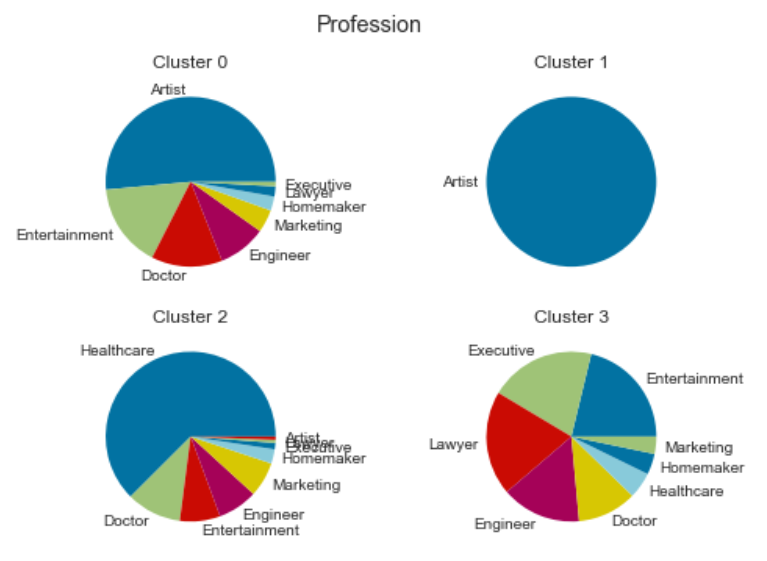
Profession:
Spending Score:
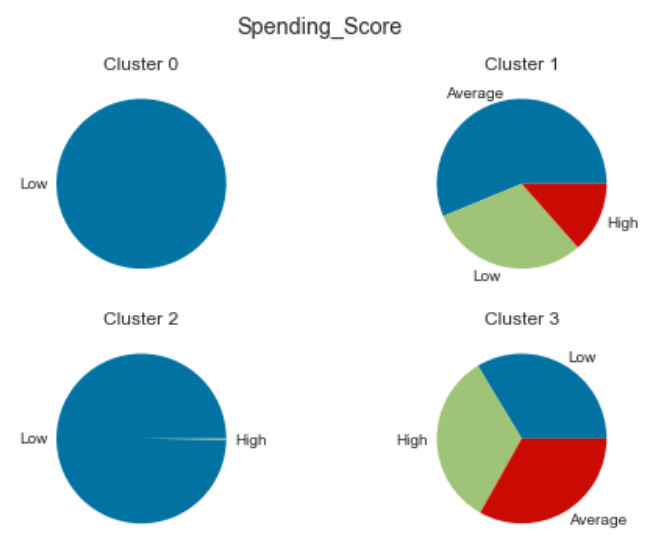
Based on the visual charts, the consumer population is mainly segmented by age, marital status, profession, and purchasing power.
We can now identify the defining traits of each cluster.
Cluster 0: Single people from the arts and entertainment sectors with low purchasing power.
Cluster 1: Middle-aged, married people in the arts sector with average purchasing power.
Cluster 2: Young, single people without higher education and with low purchasing power.
Cluster 3: Older, married people with well-paying jobs and a high purchasing power.
Now that we understand the demographic makeup of each cluster, we can finally create a robust marketing strategy geared towards each group of customers.
Furthermore, any new customers can be assigned to a cluster and would receive advertisements and special offers that suit them best.
Conclusion

The degree to which data can help improve decision-making is simply astounding.
By utilizing a dataset containing customers’ personal details, we are able to effectively divide the customers into groups with well-defined traits.
You now know the usability of clustering and its role in helping businesses make decisions.
Hopefully, as part of a bigger picture, this demonstration has given a lot of insight into why businesses have such a high demand for positions pertaining to data manipulation.
In the right hands, data can be used to dramatically optimize business models, improve customer satisfaction and retention, and maximize profit margins. The current industries recognize this, which is why you can now see many job postings for positions such as data analysts, data scientists, data engineers, etc.
For businesses looking to thrive in the competitive market, it is essential to have data practitioners in their employment.
I wish you the best of luck in your data science endeavors!
References
Vetrirah. (2020). Customer Segmentation (Version 1). Retrieved November 07, 2021 from https://www.kaggle.com/vetrirah/customer.
Customer Segmentation With Clustering was originally published in Towards Data Science on Medium, where people are continuing the conversation by highlighting and responding to this story.
from Towards Data Science - Medium https://ift.tt/3mUFjqU
via RiYo Analytics


No comments