https://ift.tt/b3DtfWY In this guide, I'll walk you through a complete data analysis project using Python to investigate helicopter pr...
In this guide, I'll walk you through a complete data analysis project using Python to investigate helicopter prison escapes throughout history. You'll learn how to collect data from Wikipedia, clean it, perform basic analysis, and visualize your findings using Python's fundamental tools.
This guided project is designed for beginners who are learning Python basics like lists, loops, and conditional logic. By working with a real-world dataset on an unusual topic, you'll gain practical experience applying these concepts while practicing the core data analysis workflow: data collection, cleaning, analysis, and visualization.
What You'll Learn
By the end of this project, you'll know how to:
- Import and manipulate data in Python
- Clean and prepare raw data for analysis
- Create frequency tables using different Python approaches
- Visualize data with simple charts
- Compare the efficiency of different data structures (lists vs. dictionaries vs. DataFrames)
Setting Up Your Environment
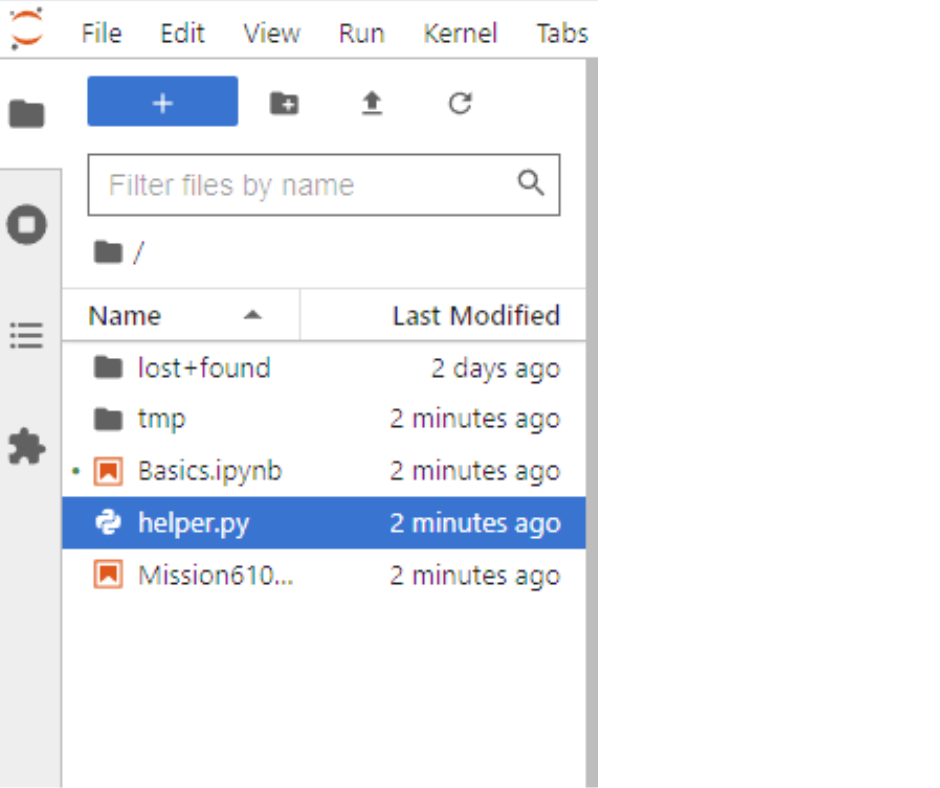
1. Set Up Your Workspace
We'll work with a .ipynb file, which can be rendered in the following tools:
- Jupyter Notebook (local installation required)
- Google Colab (browser-based, no installation needed)
2. Download the Resource File
We will be utilizing a helper.py file that includes functions to work with web data, visualize it and more, so make sure to download the helper.py file from the lesson if you want to work locally.
For this project, you'll need a Python environment with a few basic libraries. If you're working on the Dataquest platform, everything is already set up for you. If you're working locally, you'll need:
- Python 3.x
- Jupyter Notebook or JupyterLab
- Matplotlib for visualization
Let's begin by importing all of the functions in the helper.py file. In a real-world project, these functions would handle tasks that are beyond the scope of our current analysis but are necessary for the project to run smoothly.
from helper import *Getting the Data
One of the cool aspects of this project is that we're pulling our data directly from Wikipedia. Rather than working with a static CSV file, we'll be scraping a live Wikipedia page that lists helicopter prison escapes throughout history.
url = "https://en.wikipedia.org/wiki/List_of_helicopter_prison_escapes"
data = data_from_url(url)
The data_from_url function is handling the web scraping for us, extracting the information from the Wikipedia table and converting it into a format we can work with.
Instructor Insight: Working with live data adds an interesting dimension to this project. Unlike static datasets, web-sourced data may change between when you develop your analysis and when someone else runs it. This is a common challenge in real-world data science because data is rarely static and can be updated at any time.
Let's take a look at what our data looks like:
print(len(data))  # Check how many entries we have
print(type(data))  # Check the data structure type
50
<class 'list'>Our data is stored as a list with 50 entries. Now let's examine the first few entries to understand the structure:
for row in data[:3]:
    print(row)
['August 19, 1971', 'Santa Martha Acatitla', 'Mexico', 'Yes', 'Joel David Kaplan Carlos Antonio Contreras Castro', "Joel David Kaplan was a New York businessman who had been arrested for murder in 1962 in Mexico City and was incarcerated at the Santa Martha Acatitla prison in the Iztapalapa borough of Mexico City. Joel's sister, Judy Kaplan, arranged the means for to help Kaplan escape, and on August 19, 1971, a helicopter landed in the prison yard. The guards mistakenly thought this was an official visit. In two minutes, Kaplan and his cellmate Carlos Antonio Contreras, a Venezuelan counterfeiter, were able to board the craft and were piloted away, before any shots were fired.[9] Both men were flown to Texas and then different planes flew Kaplan to California and Castro to Guatemala.[3] The Mexican government never initiated extradition proceedings against Kaplan.[9] The escape is told in a book, The 10-Second Jailbreak: The Helicopter Escape of Joel David Kaplan.[4] It also inspired the 1975 action movie Breakout, which starred Charles Bronson and Robert Duvall.[9]"]
['October 31, 1973', 'Mountjoy Jail', 'Ireland', 'Yes', "JB O'Hagan Seamus TwomeyKevin Mallon", 'On October 31, 1973 an IRA member hijacked a helicopter and forced the pilot to land in the exercise yard of Dublin\'s Mountjoy Jail\'s D Wing at 3:40\\xa0p.m., October 31, 1973. Three members of the IRA were able to escape: JB O\'Hagan, Seamus Twomey and Kevin Mallon. Another prisoner who also was in the prison was quoted as saying, "One shamefaced screw apologised to the governor and said he thought it was the new Minister for Defence (Paddy Donegan) arriving. I told him it was our Minister of Defence leaving." The Mountjoy helicopter escape became Republican lore and was immortalized by "The Helicopter Song", which contains the lines "It\'s up like a bird and over the city. There\'s three men a\'missing I heard the warder say".[1]']
['May 24, 1978', 'United States Penitentiary, Marion', 'United States', 'No', 'Garrett Brock TrapnellMartin Joseph McNallyJames Kenneth Johnson', "43-year-old Barbara Ann Oswald hijacked a Saint Louis-based charter helicopter and forced the pilot to land in the yard at USP Marion. While landing the aircraft, the pilot, Allen Barklage, who was a Vietnam War veteran, struggled with Oswald and managed to wrestle the gun away from her. Barklage then shot and killed Oswald, thwarting the escape.[10] A few months later Oswald's daughter hijacked TWA Flight 541 in an effort to free Trapnell."]Each entry contains information about a helicopter prison escape attempt, including the date, prison name, country, whether it succeeded, the escapee(s), and a detailed description. The descriptions are very long, and we don't need them for our analysis, so let's clean our data by removing them.
Cleaning the Data
Data cleaning is an essential step in any analysis. For this project, we'll start by removing the lengthy descriptions from our data, which is in the last column. We’ll remove it by slicing data:
index = 0
for row in data:
    data[index] = row[:-1]  # Keep everything except the last element
    index += 1
Now let's confirm our cleaning worked:
print(data[:3])[['August 19, 1971', 'Santa Martha Acatitla', 'Mexico', 'Yes', 'Joel David Kaplan Carlos Antonio Contreras Castro'], ['October 31, 1973', 'Mountjoy Jail', 'Ireland', 'Yes', "JB O'Hagan Seamus TwomeyKevin Mallon"], ['May 24, 1978', 'United States Penitentiary, Marion', 'United States', 'No', 'Garrett Brock TrapnellMartin Joseph McNallyJames Kenneth Johnson']]Much better! Now each entry is more manageable, containing just the key information we need.
Next, we need to standardize the dates. Currently, they're in a format like "August 19, 1971," but for our analysis, we just need the year:
for row in data:
    date = fetch_year(row[0])
    row[0] = date
Instructor Insight: When working with dates in data analysis, it's common to extract just the components you need. Here, we're only interested in yearly trends, so we extract just the year. If we were looking for seasonal patterns, we might keep the month instead.
Let's check our progress:
print(data[:3])[[1971, 'Santa Martha Acatitla', 'Mexico', 'Yes', 'Joel David Kaplan Carlos Antonio Contreras Castro'], [1973, 'Mountjoy Jail', 'Ireland', 'Yes', "JB O'Hagan Seamus TwomeyKevin Mallon"], [1978, 'United States Penitentiary, Marion', 'United States', 'No', 'Garrett Brock TrapnellMartin Joseph McNallyJames Kenneth Johnson']]Great! The dates have been converted to just the years, which will make our analysis easier.
Analyzing Prison Escapes by Year
Now that our data is clean, let's analyze which years had the most helicopter prison escape attempts.
First, let's find the range of years in our dataset:
min_year = min(data, key=lambda x: x[0])[0]
max_year = max(data, key=lambda x: x[0])[0]
print(min_year)
print(max_year)
1971
2020Now, let's create a list of all years from the minimum to the maximum. This will ensure we account for years where no escapes occurred:
years = []
for year in range(min_year, max_year + 1):
    years.append(year)
Next, we'll create a frequency table to count escape attempts per year:
attempts_per_year = []
for year in years:
    attempts_per_year.append([year, 0])
Now, we'll loop through our data and increment the count for each year:
for row in data:
    for year_attempt in attempts_per_year:
        year = year_attempt[0]
        if row[0] == year:
            year_attempt[1] += 1
[[1971, 1], [1972, 0], [1973, 1], [1974, 0], [1975, 0], [1976, 0], [1977, 0], [1978, 1], [1979, 0], [1980, 0], [1981, 2], [1982, 0], [1983, 1], [1984, 0], [1985, 2], [1986, 3], [1987, 1], [1988, 1], [1989, 2], [1990, 1], [1991, 1], [1992, 2], [1993, 1], [1994, 0], [1995, 0], [1996, 1], [1997, 1], [1998, 0], [1999, 1], [2000, 2], [2001, 3], [2002, 2], [2003, 1], [2004, 0], [2005, 2], [2006, 1], [2007, 3], [2008, 0], [2009, 3], [2010, 1], [2011, 0], [2012, 1], [2013, 2], [2014, 1], [2015, 0], [2016, 1], [2017, 0], [2018, 1], [2019, 0], [2020, 1]]Let's visualize our findings with a simple bar chart:
%matplotlib inline
barplot(attempts_per_year)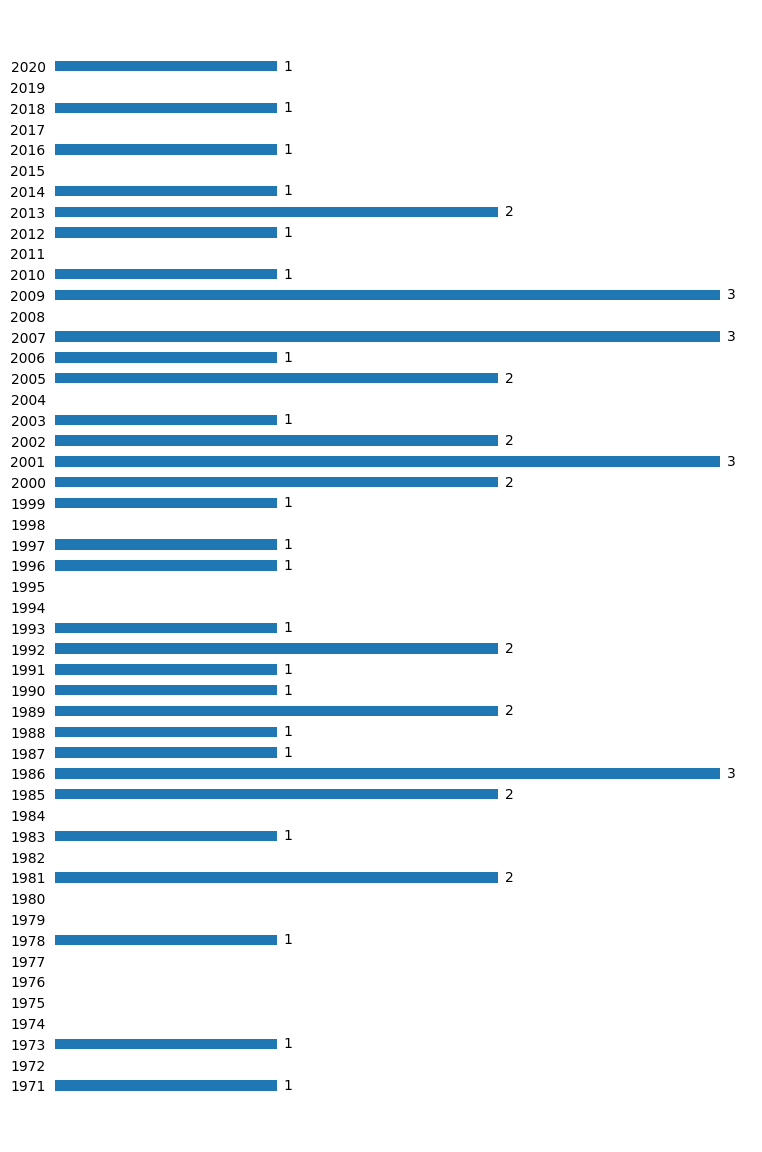
Instructor Insight: From this visualization, we can see that helicopter prison escapes aren't particularly common in any given year, with most years having 0-1 attempts. However, there are interesting spikes in the mid-1980s, early 2000s, and around 2007-2009, where multiple attempts occurred in the same year. This could be due to copycat attempts inspired by successful escapes, or perhaps changes in prison security measures over time.
Analyzing Escapes by Country
Now let's look at which countries have had the most helicopter prison escapes.
First, we need to get a list of all countries in our dataset:
countries = []
for row in data:
    country = row[2]
    if country not in countries:
        countries.append(country)
Now let's count the frequency of escapes in each country using our basic Python skills:
countries_frequency = []
for country in countries:
    countries_frequency.append([country, 0])

for country_attempt in countries_frequency:
    country = country_attempt[0]
    for row in data:
        if row[2] == country:
            country_attempt[1] += 1
This approach works, but it's not the most efficient. In real-world data analysis, we often have multiple ways to solve the same problem. Let's compare some alternative approaches:
Using Dictionaries (More Efficient)
countries = {}
for row in data:
    country = row[2]
    if country not in countries:
        countries[country] = 1
    else:
        countries[country] += 1
Instructor Insight: Dictionaries are often more efficient than lists for tasks like counting frequencies because they use hash tables, allowing for O(1) lookup time compared to O(n) for lists. This performance difference becomes more significant with larger datasets. During a technical interview I once panicked because I couldn't remember the pandas method for frequency counts, but knowing how to do it with basic Python would have been sufficient!
Using Pandas (Most Efficient)
For those familiar with pandas, we can accomplish this task even more efficiently using that pandas DataFrame method (value_counts()) I struggled to remember:
import pandas as pd

df = pd.DataFrame(data, columns=["Date", "Prison name", "Country", "Succeeded", "Escapee"])
countries_frequency = df["Country"].value_counts()
print_pretty_table(countries_frequency)| Country | Number of Occurrences |
|---|---|
| France | 15 |
| United States | 8 |
| Canada | 4 |
| Belgium | 4 |
| Greece | 4 |
| United Kingdom | 2 |
| Australia | 2 |
| Brazil | 2 |
| Netherlands | 1 |
| Italy | 1 |
| Mexico | 1 |
| Chile | 1 |
| Russia | 1 |
| Ireland | 1 |
| Puerto Rico | 1 |
From our analysis, we can see that France has the highest number of helicopter prison escapes with 15 attempts, followed by the United States with 8.
Review
In this project, we've analyzed helicopter prison escapes using basic Python skills. We learned how to:
- Import data from a web source
- Clean and process data for analysis
- Create frequency tables using different Python approaches
- Visualize our findings
We discovered that helicopter prison escapes peaked in certain years (1986, 2001, 2007, and 2009) and are most common in France and the United States.
Next Steps
If you want to extend this project, here are some ideas:
- Analyze the success rate of helicopter escapes by country or decade
- Investigate whether multiple escapees affect success rates
- Look for patterns in repeat escapees
- Explore correlations between prison security levels and escape attempts
If you're ready to take your Python skills to the next level, check out Dataquest's Python Basics for Data Analysis skill path or our Data Analyst in Python career path.
Remember, the key to mastering data analysis is practice. Try to apply these techniques to datasets that interest you!
Happy coding!
from Dataquest https://ift.tt/3j2gf6k
via RiYo Analytics


No comments