https://ift.tt/JmRIzWl A real-world test on MassMutual’s production model Co-authored with Dmytro Karabash Photo by Jason Pogacnik on ...
A real-world test on MassMutual’s production model
Co-authored with Dmytro Karabash

In our previous article, “Hidden Data Science Gem: Rainbow Method for Label Encoding”, we discussed the advantages of using label encoding over one-hot encoding for categorical variables, especially when developing tree-based models. We introduced the Rainbow method, which helps identify the most appropriate ordinal encoding for different types of categorical variables.
In this article, we will continue exploring the Rainbow method— this time, from a practical perspective, demonstrating its effectiveness using a real project developed by the Data Science team at MassMutual, an esteemed life insurance company that prides itself on promoting data scientists, engineers, and technologists to help make informed business decisions.
Business Use Case
The goal is to predict one of five Mindset Segments for each prospective customer. Essentially, it is a multi-class classification problem.
The segmentation framework comprises five classes that reflect a person’s age, financial stability, and attitude toward financial decisions. The MassMutual marketing team then uses the predicted segments in various campaigns for targeting and customization.
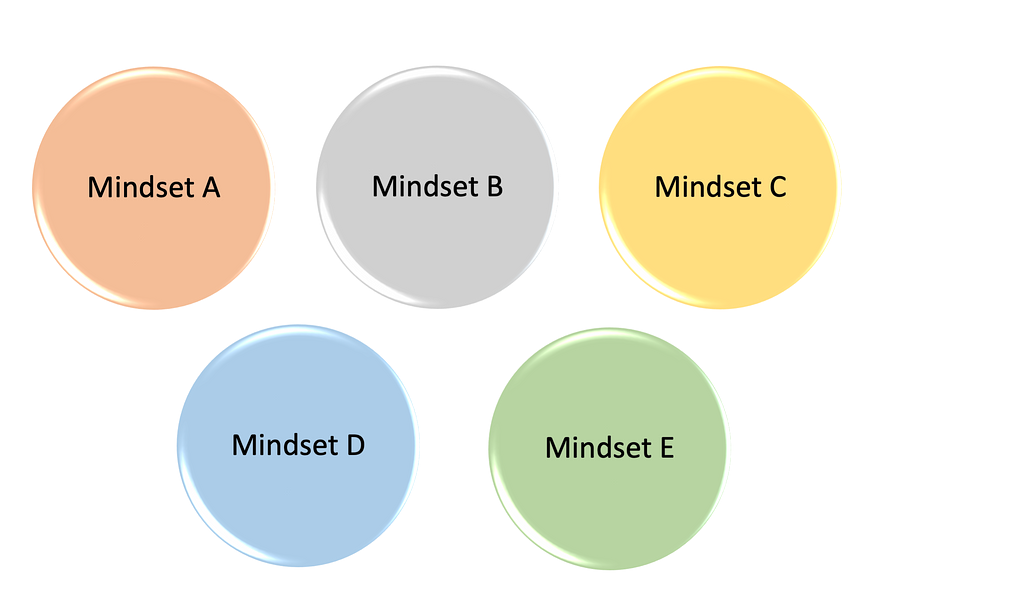
For instance, customers exhibiting Mindset A tend to prioritize independence and autonomy in deciding whether to purchase a life insurance policy, whereas customers with Mindset B often prefer to receive guidance and detailed explanations of various financial products from a dedicated advisor.
The data represent a small set of labeled individuals (17.5K persons) with labels provided by a MassMutual vendor who designed the segment assignment rules. We first added columns from our main prospect database to this data. The objective is to learn the best model using these target labels and available features, and predict segments for all other (unlabeled) prospective customers.
We use a consumer database that covers approximately 300 columns representing a diverse range of demographic characteristics, such as household composition, income and net worth propensities, financial behavior, and digital savviness.
In this article, we compare the conventional One-hot encoding with the ordinal encoding via the Rainbow method using the consumer database and the Mindset Segmentation project. We showcase a few standard metrics — such as Macro Avg F1 score, Macro Avg AUC ROC, Cohen’s Kappa, and Accuracy — for interpretation and comparison purposes in this 5-class classification problem.
Categorical Variables
We selected all categorical variables in the consumer database — including interval, ordinal, and nominal variables — but excluded quantitative and binary variables. The aim is to demonstrate the difference in model performance between One-hot and Rainbow encoding for the same set of categorical factors.
We performed a target stratified 4-fold Cross-Validation split, and all data processing from this point was done inside the cross-validation loop. This included creating One-hot features and Rainbow features from each fold’s train set and then applying them to each fold’s validation set.
The total set of 111 variables was transformed into 121 Rainbow features, and alternatively into 2260 One-hot features.
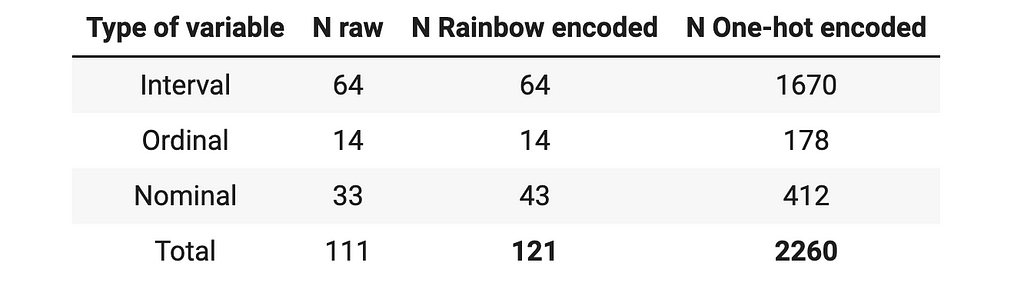
The Rainbow transformation for interval and ordinal variables was straightforward, resulting in 64 Rainbows from 64 interval features and 14 Rainbows from 14 ordinal features.
The nominal variables’ transformation was more involved, where we created 23 natural attribute Rainbows and 20 artificial Rainbow features for the remaining 10 variables. Since we were dealing with five classes, we applied correlation ordering and target percent ordering for a random class (see the section Automated Rainbow Selection of the original article). For example, the nominal variable “Financial_Cluster” was transformed into features “Financial_Cluster_Mindset_B_correlation_rank” and “Financial_Cluster_Mindset_D_target_percent”. Overall, 33 nominal variables were transformed into 43 Rainbows.
Making a choice on the actual ordering — whether it be a natural attribute Rainbow or artificial Rainbow — is highly project and context-specific, and is more of an art than a science. It requires balancing model simplicity, performance, and interpretability.
Unlike ordinal encoding, One-hot transformation generates over two thousand features.
Why do we make One-hot features for interval and ordinal variables here? Because we want to compare Rainbow with One-hot on the full continuum of possible ordering — from perfect order, to fuzzy order, to no order (or wrong order).
Additionally, the classification of a variable into ordinal or nominal is sometimes a subjective decision. One bright example is Color. As we discussed in our first article, Color is considered nominal by some modelers, and ordinal by others.
Initially, we pooled all categorical variables, but later in the article, we analyzed interval, ordinal, and nominal variables separately.
We trained all XGBoost models covering the hyperparameter space shown below:
params = {
    'objective': 'multi:softprob',
    'eval_metric': 'mlogloss',
    'num_class': 5,
    'subsample': 0.8,
    'max_depth': [2, 3, 5],
    'eta': [0.1, 0.3, 0.5],
    'n_estimators': [50, 100, 200],
}
We avoided setting max_depth higher than 5 due to the relatively small data size and the need to have at least 100 samples at the end of each branch. We preferred using a simple model, which also helps prevent overfit.
All of the results below represent cross-validation average metrics.
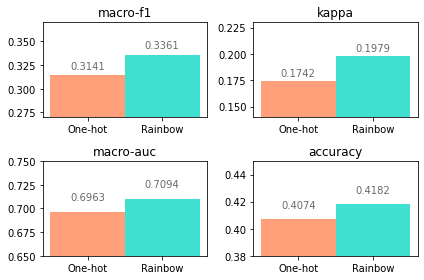
Aggregate Results
Let us start with the overall averages across all runs. Clearly, the average metrics across all models are higher for Rainbow encoding. The overall difference is a few percentage points.
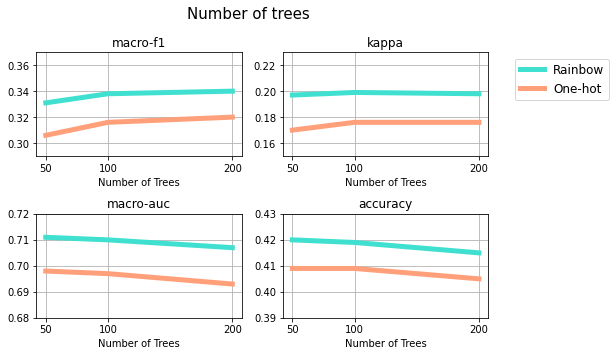
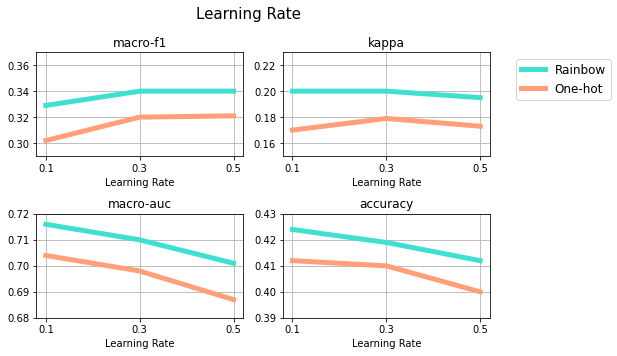
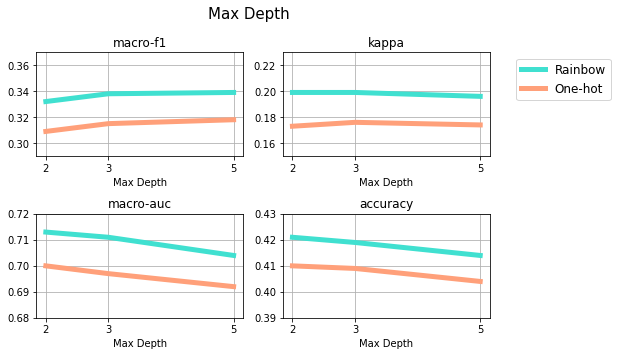
Hyperparameters
The plots below illustrate the changes in metrics for each hyperparameter while keeping all other hyperparameters constant. These plots also clearly demonstrate that Rainbow outcomes exceed One-hot outcomes for each hyperparameter and metric.
Runtime
Next, let’s compare the runtimes for each method.
One-hot: 65.059 s
Rainbow:  5.491 s
The average time to run a single Rainbow model is nearly 12 times faster than that of a single One-hot model! So, in addition to significantly improving the model performance metrics, we can see that the Rainbow method can also save data scientists an enormous amount of time.
Interval, Ordinal, and Nominal
Next, we ran the models which covered the bundles of interval, ordinal, and nominal features separately. The results are listed below.
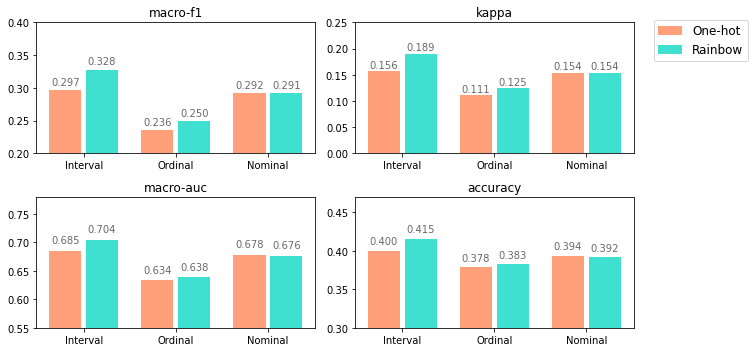
These outcomes once again highlight the fact that Rainbow is preferred to One-hot. As expected, interval and ordinal features gain the most from Rainbow encoding — less so for nominal variables.
Clearly, the more defined the category order, the higher the benefits of preferring Rainbow to One-hot. While the performance of Rainbow for nominal variables is either similar or negligibly lower than One-hot, it still achieves the same level of performance in considerably less time by using substantially less space, and the resulting model is significantly simpler.
Feature Selection
Finally, to ensure a fair comparison in terms of dimensionality, we selected the top 10, 50, and 100 features from each feature set (Rainbow and One-hot). We utilized the feature importance attribute of the XGBoost model and aggregated feature importance scores for four cross-validation folds on the best hyperparameter set for each encoding type. The results are presented below.

Rainbow encoding outperforms One-hot encoding with ease, particularly for a smaller number of features. Rainbow encoding reaches its peak performance faster than One-hot encoding and utilizes fewer features. Indeed, with only 10 features, Rainbow encoding is already near its peak, while it takes One-hot encoding 50–100 features to reach a similar level!
Furthermore, Rainbow encoding even exhibits better results for 50 features than One-hot encoding does for 100 features. It is worth noting that when reducing the feature count from 50 to 10, the reduction in Macro-F1 for One-hot encoding is six times higher than that of the Rainbow method (three times for Kappa and Accuracy, and two times for Macro-AUC).
Concluding Notes
The example of the Mindset Segmentation model at MassMutual clearly illustrates that Rainbow label encoding is superior to One-hot encoding. Not only does it save significant time for modelers, it also substantially reduces dimensionality and provides an organic framework for feature selection. Moreover, if the chosen Rainbow order agrees with the data-generating process, then this encoding can also lead to significant improvements in model performance metrics.
Case Study: Practical Label Encoding with Rainbow Method was originally published in Towards Data Science on Medium, where people are continuing the conversation by highlighting and responding to this story.
from Towards Data Science - Medium
https://towardsdatascience.com/case-study-practical-label-encoding-with-rainbow-method-d167c386e78?source=rss----7f60cf5620c9---4
via RiYo Analytics


No comments