https://ift.tt/NU74SuB Quickly spot your unhappy customers & prevent bad reviews from spreading virally by getting real-time alerts P...
Quickly spot your unhappy customers & prevent bad reviews from spreading virally by getting real-time alerts

Context
Every business might have just one bad day or even a single poor customer service event that could potentially make a customer extremely unhappy. Nowadays, most unhappy customers vent out their anger on social media and before you notice, the bad news could be amplified several times leading to considerable damage to the brand image.
If the business is able to spot these messages as soon as they are posted, there is scope for some damage control. However, this is highly impractical considering the deluge of social media posts and trying to find the “one bad needle” from the haystack.
How NLP can help?
This is where a combined approach of sentiment analysis, automated keyword extraction, dynamic data visualization, and a real-time alerting mechanism could help mitigate the viral spread of a bad review or negative opinion about your brand by providing real-time alerts.
This will help the business declutter all the posts and extract what is relevant and needs immediate action.
What is sentiment analysis?
If you have not read my previous article on sentiment analysis, please find below a concise overview of sentiment analysis:
Sentiment analysis is also called “Opinion Mining”. Sentiment analysis assigns a score to a string of text based on the emotional tones of the words used in the text.
Sentiment scores — Positive, Negative & Neutral
- “I am super happy with the service” is an example of a text with a positive sentiment. This will usually have a sentiment score closer to +1.
- “I am extremely disappointed with the service” is an example of a string with a negative sentiment and will have a sentiment score closer to -1.
- “I availed the service in the last week of May” is an example of a sentence with a neutral sentiment. This will have a sentiment score close to 0.
What does a dynamic sentiment dashboard look like?
Demonstrated below is a simple yet powerful prototype of a good sentiment dashboard. Let us look at the various parts of the dashboard.
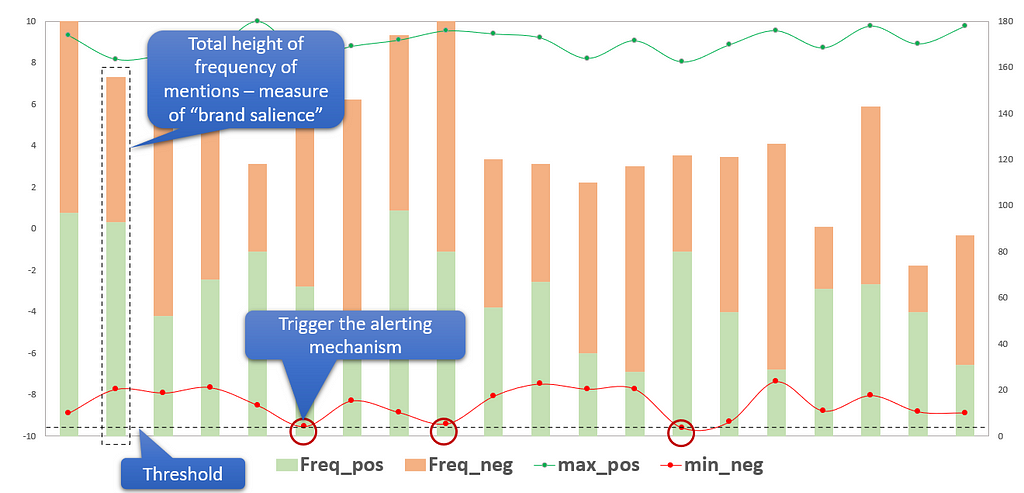
- The horizontal axis is the time series axis where the time interval depends on what is suitable for the business.
- There are 2 vertical axes — the primary axis consists of the frequency of reviews and the secondary axis consists of the sentiment scores.
- The frequency of positive & negative reviews plotted together gives us a few insights:
The height of both the bars put together shows the number of mentions made about the brand and is an indicator of “brand salience”.
The proportion of the positive to negative reviews gives an overall picture of the general opinion of the brand. A higher positive ratio is favorable and a higher negative ratio is unfavorable to the brand.
4. The green line is a plot of the maximum positive sentiment score for the brand in that time interval and the red line indicates the maximum negative sentiment score.
These two lines help in identifying the happiest customer and the most unhappy customer for that time interval.
5. The threshold line indicates the negative sentiment score below which the real-time alerting system should be activated.
Setting the threshold at a more negative score could potentially lead to some unhappy customers slipping away unnoticed whereas a higher threshold value might trigger a lot of alarms increasing the efforts of the customer experience team.
Steps to create a dynamic sentiment dashboard
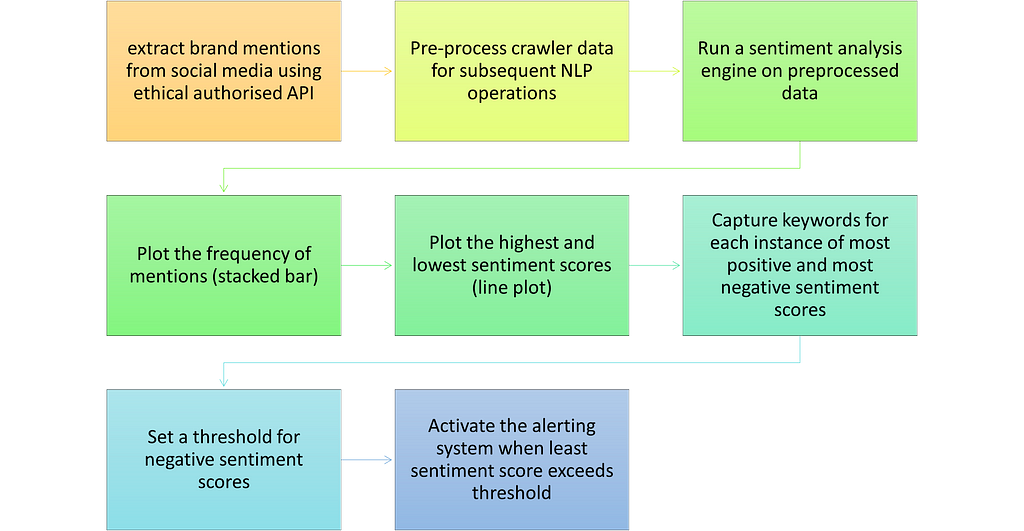
- The first step is to extract all social media posts, reviews from online review platforms, and mentions of the brand on a real-time basis. Almost all leading social media platforms and review portals provide secure and authorized API to facilitate extracting content. Make sure that the content extraction is ethical with the relevant permissions and authorization.
- Ensure that the metadata corresponding to the extracted data including date/time of post, location (if available), social media use information, etc
- The collected data needs to be pre-processed and made suitable for further NLP processes.
- Set up the data tables in such a way that each mention has its metadata retrievable from the backend.
- Run a sentiment analysis engine on the collected data and collect the sentiment scores for each unit of pre-processed textual data.
- Plot the frequency of mentions and the highest and lowest sentiment scores on a time series plot. The frequency of the time series plot can be set to minute, hour, or day depending on the nature of the business.
- For each instance of the time series plot, capture the keywords/topics for the mentions with the most positive and most negative sentiment scores. This can be done using either keyword extraction or topic modeling.
- Based on how sensitive your business is to negative reviews, set a threshold for negative sentiment scores.
- Activate a real-time alerting system if the least sentiment score exceeds the threshold.
- The alerting system should send out a message to the key process owners with details extracted from the metadata.
Harvesting insights from the dynamic dashboard
The main objective of the dynamic dashboard is to provide real-time alerts for negative reviews. However, there is scope to harvest several other insights from the same data. To mention a few:
- Provide insights on the overall trend of the sentiment for the brand over time — is there a negative or positive trend?
- Provide data for segmenting and profiling reviews using clustering techniques — what is the profile of the customer who usually posts the most negative reviews? This could probably provide insights in terms of improving the product/service offering for a specific neglected customer segment.
- Feature extraction — Identify specific product features that might irk customers by performing topic modeling on the negative reviews.
Wrapping up with Potential challenges
Since the data collected is huge, it could involve a huge cost overlay for data collection, storage, and retrieval. A systematic cost-benefit analysis of the cost involved in setting up and maintaining the system vs the opportunity cost of a damaged brand image should provide clarity on whether and how much to invest.
Building Dynamic Customer Sentiment Dashboards was originally published in Towards Data Science on Medium, where people are continuing the conversation by highlighting and responding to this story.
from Towards Data Science - Medium https://ift.tt/MG6NkAg
via RiYo Analytics


ليست هناك تعليقات