https://ift.tt/ts3uzIM From tail to head, we discuss the gruesome Data innards that create beautiful graphics, reports, and insights Cue ...
From tail to head, we discuss the gruesome Data innards that create beautiful graphics, reports, and insights

A layman in data walking into a data project architectural meeting is sure to be quickly overwhelmed with engineering, math, research, and statistics. Couple that with overheated discussions about model deployment and GPUs that refuse to work with the code, and you have the perfect information storm.
At the end of the day, it’ll be all meshed together into a data sausage, where you seemingly lose track of all the separate parts but is still very much delicious to consume.
To fully understand the general process of a data project creation, we need to split it into areas of concern: what is the input and output of each step, who’s responsible, and what tools should we know to work effectively.
But first, let’s get some descriptions out of the way: what is a data project? In a nutshell, the objective of a data project is to process raw data and enrich it using some kind of aggregation/combination/statistical modeling and deliver it in a way the final user can understand.
Foundations for Architecting Data Solutions
We could further separate a data project: one such separation is in the OSEMN framework (Obtain, Scrub, Explore, Model, iNterpret) which takes care of almost everything described by the abstraction above. It is a great way for a data scientist to create standalone projects, but it still lacks a path from its development to production.
5 Steps of a Data Science Project Lifecycle
The Sausage
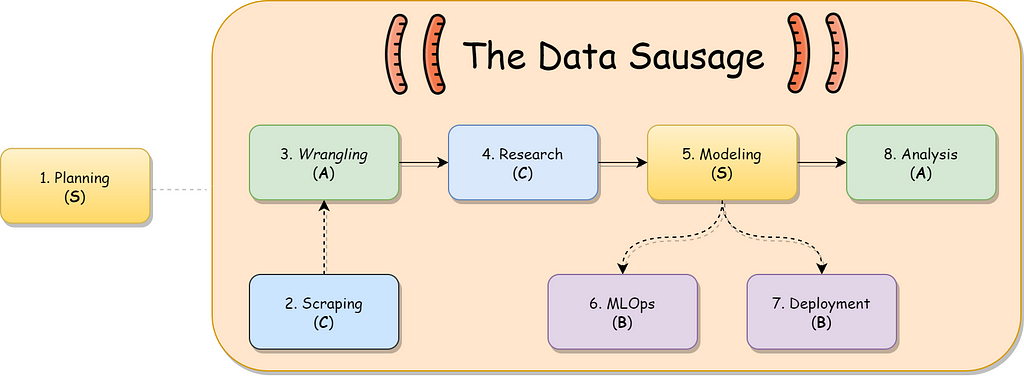
Let’s dissect the aforementioned sausage. You may notice that there is an overlap between the OSEMN steps and those discussed here in this story:
- It all starts with the planning phase, where you describe the objective of your project, the inputs and outputs of each processing step, and the roles of your team in them.
- If we don’t have the raw data at hand we must scrape (Obtain) it from somewhere, be it from an API or a webpage.
- Formatting that raw data is done during the wrangling (Scrub) phase.
- Sometimes we need that state-of-the-art model, and that’s made during the research phase.
- With everything in place, we can start modeling (Explore/Model).
- Off to the engineering part of town! We need to take care of the lifecycle of our model using MLOps…
- And deploy our solution in a production-level environment.
- Finally, we gather our enriched data and analyze (iNterpret) it using dashboards and reports.
Planning (S — Must-have)
Planning a data project means putting on paper the road that raw information needs to trail in order to become actionable knowledge. This is done through meetings and a good amount of documentation (textual and visual) describing what are the business needs, how you translate those needs through science and engineering work, what is the overall scope of the project, and who’s responsible for what.
Planning a Data Project | Online Data Literacy Training | Kubicle
This is a team effort: the scientist knows what models could be used for the task; the engineer knows how to manage data and send it from one process to the other; the PM scopes and timeboxes. A generalist is usually more valuable here compared to a specialist: linking know-how from multiple realms can decrease the chance of creating siloed institutional knowledge.
The toolkit of someone who’s involved in planning includes:
- Project management tools (JIRA, Taiga, Notion) to plan out tasks and objectives;
- Diagramming tools (Miro, Lucidchart, diagrams.net) to create visual documentation;
- A project description template (Request For Comments) to follow through. The link below is an example of a data science project RFC: the abstract part of the modeling is very well described, but it could also use timeboxing and a nicer step-by-step implementation description.
RFC 021: Data science in the pipeline
Scraping (C — Situational)
In some cases, you won’t have the raw data you need at hand. This means you need to make a process that scrapes that data from a data vendor through an API, or even from the Web itself.
This is something that’s more related to the software engineering folks but can be a good asset to a data scientist that is interested in making PoCs out of basically anything they want (respecting your country's laws about personal data, of course).
The toolkit of a scraper includes:
- A scraping framework (Scrapy, Puppeteer) that can be deployed easily;
A Minimalist End-to-End Scrapy Tutorial (Part I)
- A language to query HTML documents (XPath or CSS);
- Pipelines to save raw data locally or in the cloud (Scrapy Pipelines, AWS Firehose, GCP Dataflow);
- Raw data query and management (AWS Glue/Athena).
Web scraping @edge, AWS Kinesis Data Firehose & Glue - Vittorio Nardone
Wrangling (A — Helps your daily work)
The act of wrangling data means punching the data until it fits your database modeling. Normalization, mapping, cleaning, structuring… It all falls under the umbrella of data wrangling.
Data engineers are usually the ones that are mostly responsible for your basic data wrangling activities, managing the lineage of your tables and their structural integrity.
But we can also compare this activity to the pre-processing data scientists usually do over their datasets in order to train and predict models: L2 normalization, one-hot encoding… it’s local wrangling (used only in the model context) instead of global wrangling (used by anyone in the company).
The toolkit of a wrangler includes boots, a lasso, and:
- SQL. Most work of a wrangler will be done over SQL queries, deriving data through views and procedures, and general optimization. Getting to know the syntax of a couple of databases (PostgreSQL, MySQL, Presto) and knowing a tool for managing your data model (DBT) will bless your daily life;
- Data manipulation libraries for your chosen language (e.g., Pandas for Python, Spark in Scala);
- Data validation concepts and tools (Great Expectations, Pytest).
How To Test Your Data With Great Expectations | DigitalOcean
Research (C — Situational)
Most data science projects don’t need to have state-of-the-art accuracy metrics. For those that do, we need to research and go deep into the academic papers and blogs to craft a model that gets close to the task objective.
In theory, this type of research should be done by ML researchers and data scientists that are focused on that domain of academic knowledge. In practice, data scientists are usually expected to help with other sides of the project (wrangling, deployment, analysis) and also do research, making data science development a tad more complicated.
Your daily life as a researcher involves:
- Understanding how to search and catalog academic articles (Mendeley, arXiv, Google Scholar);
Mendeley - Reference Management Software
- Having some know-how of a neural network modeling framework (Pytorch, Tensorflow, Keras);
- Deep Learning with PyTorch: A 60 Minute Blitz - PyTorch Tutorials 1.11.0+cu102 documentation
- Keras Tutorial: The Ultimate Beginner's Guide to Deep Learning in Python
- Using GPU-accelerated processing to speed up those heavy networks (CUDA/NVIDIA, ROCm/AMD);
ROCm Learning Center - ROCm 4.5.0 documentation
- Using all the tools related to modeling…
Modeling (S — Must-have)
This is the crux of the project and the majority of the daily life of a data scientist: creating models that generate knowledge from data. This can be done using ML for more complicated tasks, but can also be done using basic statistics, aggregations, and variable combinations! Sometimes an Excel sheet with a few calculations can be the ideal solution for your problem.
But aside from basic statistical knowledge, what tools do you need to do modeling?
- Basic modeling frameworks for common domains (scikit-learn for your run-of-the-mill modeling, spaCy for language processing, OpenCV for computer vision, and pre-trained model libraries like Keras Applications);
spaCy 101: Everything you need to know · spaCy Usage Documentation
- Advanced automation tools for your daily modeling tasks (Pycaret and AutoML for pre-processing and model selection, SweetViz for exploratory data analysis);
Automate Exploratory Data Analysis With These 10 Libraries
- Data manipulation tools like Pandas and Dask are needed here as well;
- Parallel processing is essential if you have too much data: Spark is the easiest way to achieve that, and Databricks can help you with geared notebooks and managed clusters.
Get started with Databricks as a data scientist
- Other notebook serving tools can be useful as well (JupyterLab, Sagemaker).
MLOps
MLOps is the junction between Machine Learning and DevOps: tools and techniques that manage the full lifecycle of a data application. From data ingestion to deployment, it is the glue that joins all the steps in this story with observability practices, deployment policies, and data validation.
This is something that everyone involved in data projects should know in passing: data scientists that are aware of MLOps will create maintainable models with proper logging, modular design, and experiment tracking; data engineers will be able to easily orchestrate those models and deploy them in a continuous fashion.
There are a couple of libraries and tools that make MLOps way easier.
- The basics of MLOps lie in storing your ML experiment parameters and results. To do so, you can use Weights & Biases or mlflow: both are easily integrated into your model training code and may yield interesting reports right out of the bat.
- A complete Weights and Biases tutorial | AI Summer
- Machine Learning Workflow Using MLFLOW -A Beginners Guide - Analytics Vidhya
- If you are using Kubernetes in your ML pipelines, you should look to Kubeflow: it takes care of the full lifecycle of a model using all the scalability of K8s.
- If you are already using Airflow in some capacity, check out Metaflow. It allows you to modularize your training steps using DAG-like code.
Learn Metaflow in 10 mins — Netflix’s Python/R Framework for Data Science
- If you want to specialize in a cloud provider, you can also go for their own ML deployment suites like AWS Sagemaker or GCP Datalab.
Deployment
In the Deployment stage, we need to get our model to production grafting it to the current architecture. This is mainly a data engineering responsibility, but data scientists must be always ready to work together with them to adapt their codes: installing a GPU-powered library in a Docker environment, making sure the AWS Batch job is using 100% of the processing power of its instance.
The best way to skill up in this step is knowing the general archetypes of pipeline tools and what would their parallels be in other clouds. Satish Chandra Gupta has an awesome Medium article about it, go check it out!
Architecture for High-Throughput Low-Latency Big Data Pipeline on Cloud
- Usually, ML-related things should run in Docker images: lots of system and Python libraries need to be pre-installed for a training/inference code to run properly.
- You can execute those codes in EC2/Compute machines by hand, wrap them in Serverless services such as AWS Batch or GCP Cloud Functions, use external platforms such as Databricks and trigger notebooks through Airflow…
- To make your deployment look like a microservice, you can define input and output channels using message queue systems such as ActiveMQ, Kafka, SQS, Pub/Sub.
- To put this all in production, Infrastructure as Code (IaC) tools are essential for a sane CI/CD process: Terraform and the Serverless package are great companions for your infrastructure and application deploys.
The definitive guide to using Terraform with the Serverless Framework
Analysis
It’s the end of the pipeline! With all this processed data, we can start munching it into digestible dashboards and reports so we can derive actionable insights from it. In this part, we’re able to connect business metrics to modeling metrics: does our model results delivers to our client the feature we’re expecting?
How To Evaluate The Business Value Of a Machine Learning Model
The responsibility for this part is mainly on the hands of data analysts, with abilities that involve statistics (to understand the data), dashboarding (to create reports), and user experience (to create good reports). Data scientists are also part of this process through storytelling, explaining their model results and objectives.
- The best data analysis tools are the suites we’re already familiar with: Tableau, Looker, PowerBI. Those are pricey but well-worth their licensing fees. Apache Superset is an open-source alternative.
- Dashboarding tools are also great for the analysis process: I’ve personally used a lot of Metabase, with connectors to all kinds of databases and a simple deployment script. You can also be interested in Redash and Google Data Studio.
- But the best tool for this step is not a concrete one: business domain knowledge is essential to see the connections between the needs of the clients and possible data-related features.
Data projects are often risky endeavours, but with proper planning, toolkit, and role definition we can minimize the time from ideation to execution. If you want to increase your impact and range as a developer, start looking for resources to learn neighboring areas (e.g., if you know how to do Wrangling, you can work on your Modeling chops, or see how your Ingestion pipelines work).
This story is the summary of the talk I’ve given in #theDevConf 2022, TDC Connections.
The Skeleton of a Data Science Project was originally published in Towards Data Science on Medium, where people are continuing the conversation by highlighting and responding to this story.
from Towards Data Science - Medium https://ift.tt/zpXEleA
via RiYo Analytics


No comments