https://ift.tt/3KCoomX A friendly introduction to a perennially popular clustering algorithm This is going to be the second installment (...
A friendly introduction to a perennially popular clustering algorithm
This is going to be the second installment (only because installment sounds fancier than article!) in the Explaining Machine Learning Algorithms to 10-year Olds series. You can find the XGBoost Classification article here. Today we’ll be explaining K-Means Clustering, a very popular clustering algorithm, to a 10-year-old or basically anyone that is new to the wondrous world of ML Algorithms. We are going to eliminate the gory, math-y details from it and explain the simple intuition behind it.
Before we start with the algorithm, let’s understand what clustering is. Clustering involves automatically discovering natural grouping in data. Usually, when we are given data that we can visualize (2- or maybe even 3-dimensional data), the human eye can quite easily form distinct clusters. But it’s a little harder for machines to do so. That’s where clustering algorithms come into the picture. And this is also extrapolated to higher dimensions to cluster data that even the human eye can’t. Now that we have that out of the way, K-Means here we go!
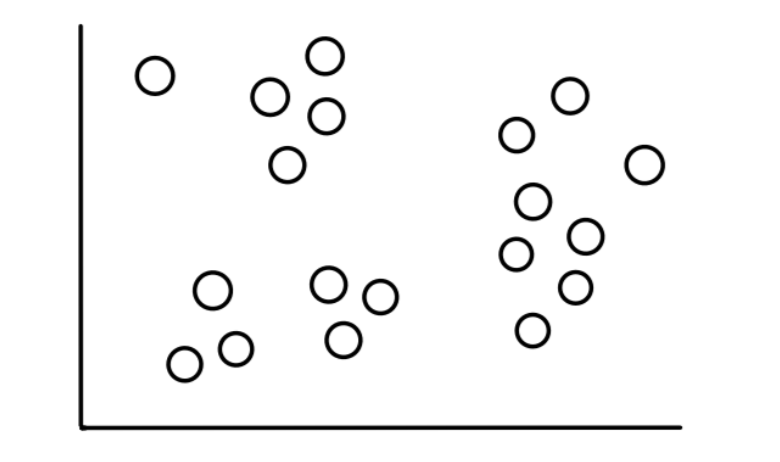
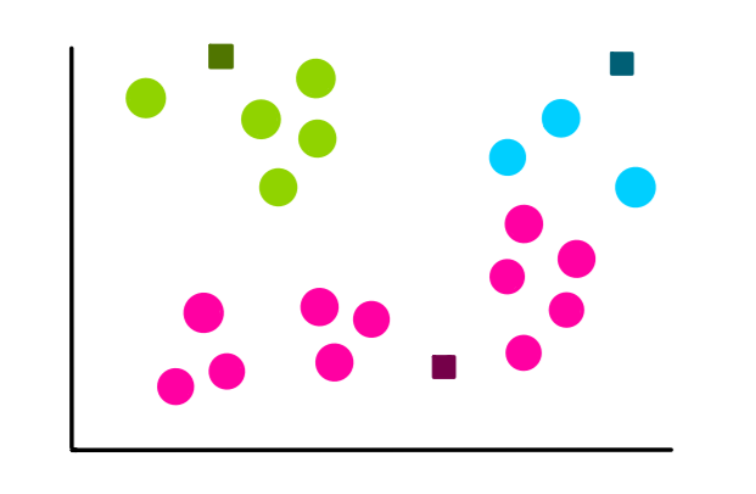
Imagine we have 19 data points that look like this:
Now assume that we know this data fits into 3, relatively obvious, categories that look like this:
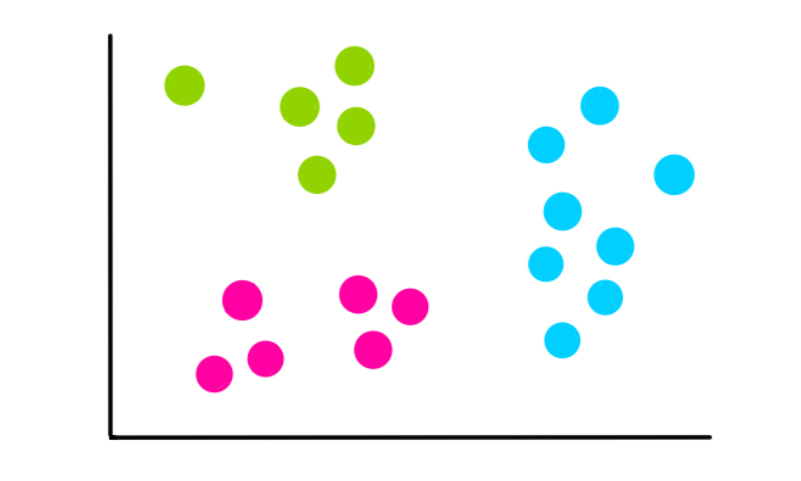
Our task is to use the K-means Clustering algorithm to do this categorization.
Step 1: Select the Number of Clusters, k
The number of clusters we want to identify is the k in k-means clustering. In this case, since we assumed that there are 3 clusters, k = 3.
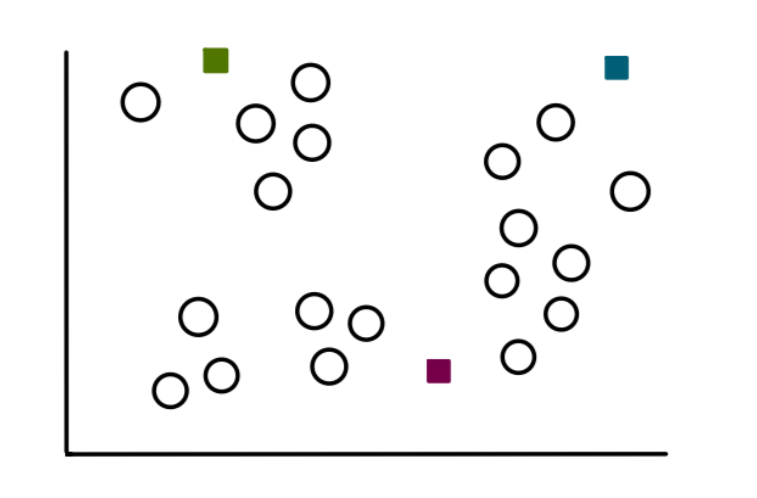
Step 2: Select k Points at Random
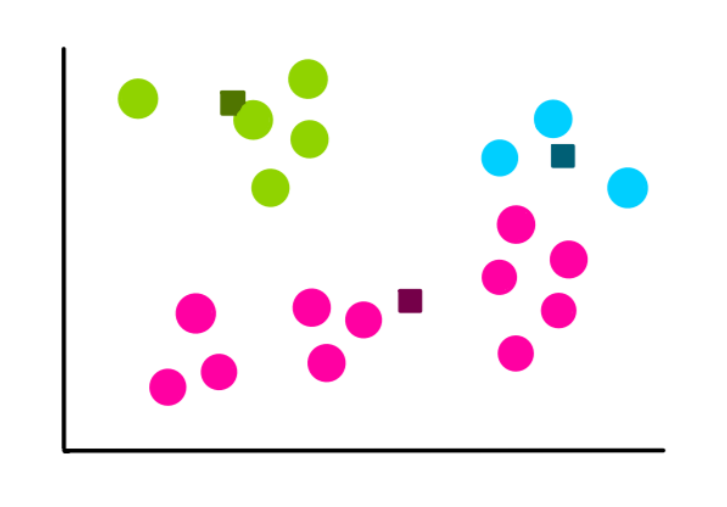
We start the process of finding clusters by selecting 3 random points (not necessarily our data points). These points will now act as centroids, or the center, of clusters that we are going to make:
Step 3: Make k Clusters
To make the clusters, we start by measuring the distance from each data point to each of the 3 centroids. And we assign the points to the cluster closest to it. So for a sample point, the distances will look like this:
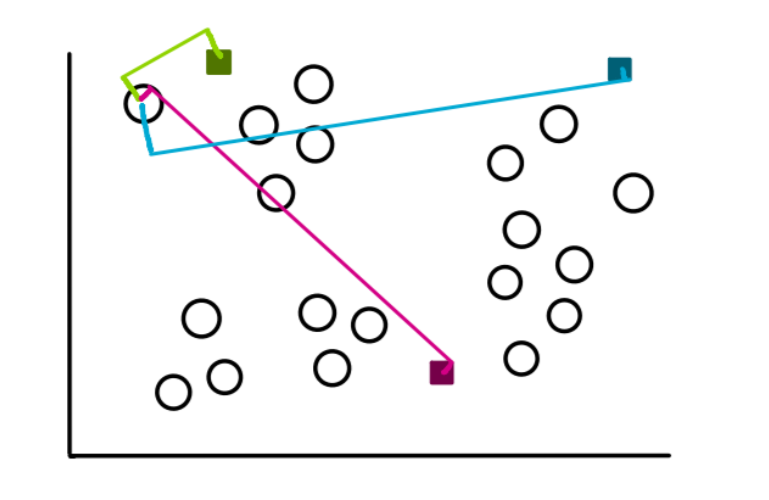
By just looking at it, we see that the distance from the point to the green centroid is the least, so we assign the point to the green cluster.
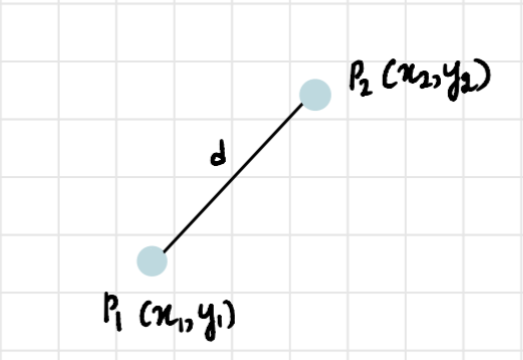
In two dimensions, the formula to find the distance between two points is:

Using the above formula, we repeat this process for the rest of the points and the clusters will look something like this:
Step 4: Compute New Centroid of Each Cluster
Now that we have our 3 clusters, we find the new centroids formed by each of them. For instance, the way we calculate the coordinates of the centroid of the blue cluster is:
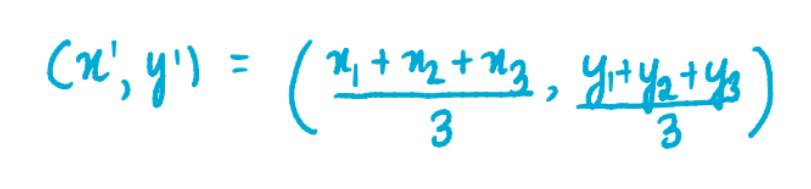
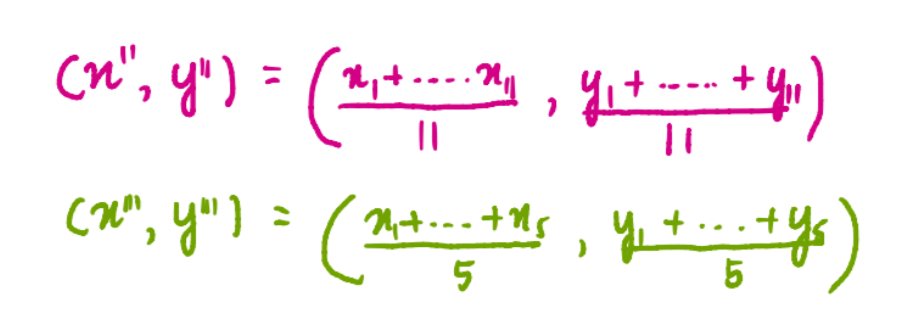
where x1, x2, and x3 are the x-coordinates of each of the 3 points of the blue cluster. And y1, y2, and y3 are the y-coordinates of each of the 3 points of the blue cluster. We divide the sum of the coordinates by 3 because there are 3 data points in the blue cluster. Similarly, the coordinates of the centroids of the pink and green clusters are:
So, the new centroids look like this:
Step 4: Assess the Quality of Each Cluster
Since k-means can’t see the clustering as we can, it measures the quality by finding the variation within all the clusters. The basic idea behind k-means clustering is defining clusters so that the within-cluster variation is minimized. We calculate something called Within-Cluster Sum of Square to quantify this variation:
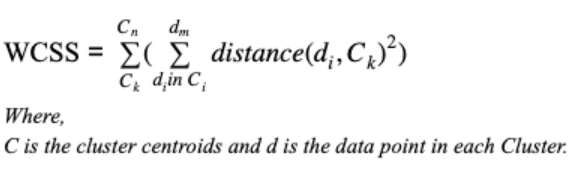
But for simplification purposes, let’s represent the variation visually like this:

Step 5: Repeat Step 3–5
Once we have previous clusters and the variation stored, we start all over. But only this time we use the centroids we calculated previously to - make 3 new clusters, recalculate the center of the new clusters, and calculate the sum of the variation within all the clusters.
Let’s suppose the next 4 iterations look like this:
From the last two iterations, we see that the clusters haven’t changed. This means that the algorithm has converged and we stop the clustering process. We then choose the clusters with the least WCSS. This also happens to be those of the last two iterations. So, they are going to be our final clusters.
How do we choose k?
In our example, we conveniently knew that we need 3 clusters. But what if we don't know how many clusters we have, then how do we choose k?
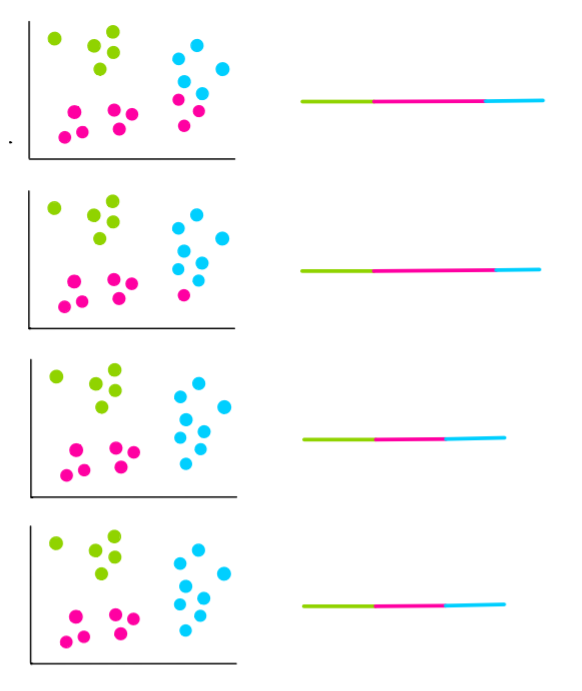
In this case, we try multiple k values and calculate the WCSS.
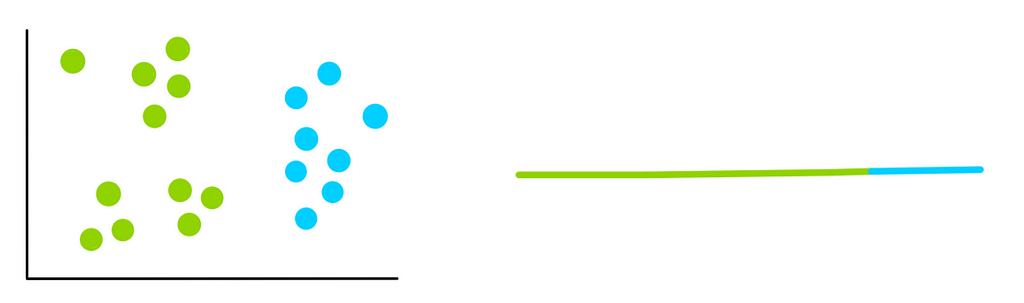
k=1:
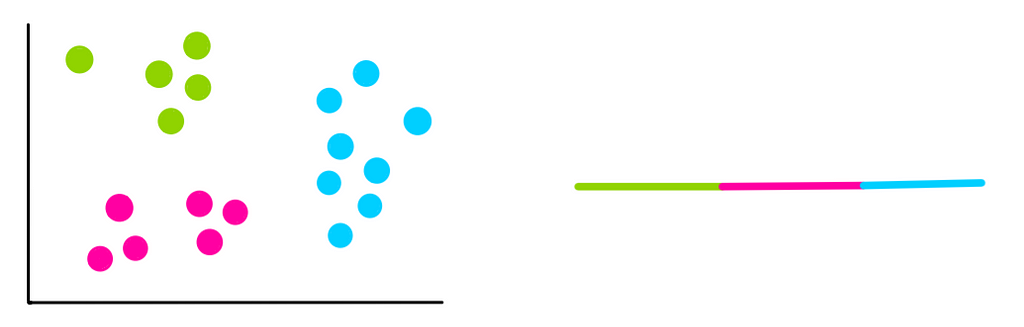
k=2:
k=3:
k=4:
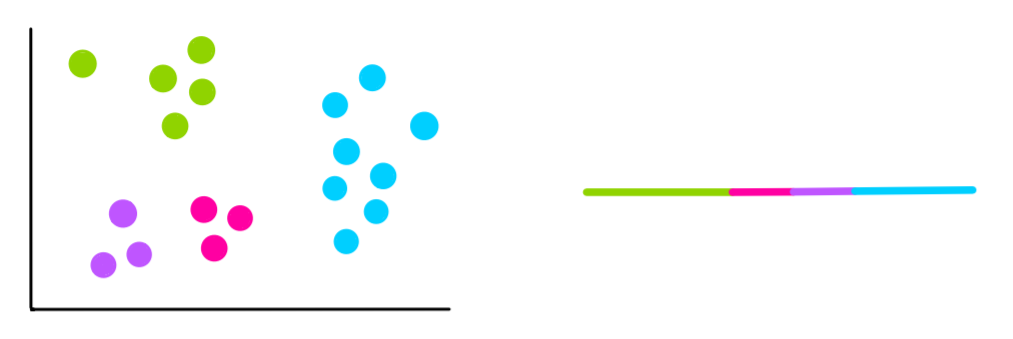
We notice that each time we add a new cluster, the total variation within each cluster is smaller than before. And when there is only one point per cluster, the variation = 0.
So, we need to use something called an elbow plot to find the best k. It plots the WCSS against the number of clusters or k.
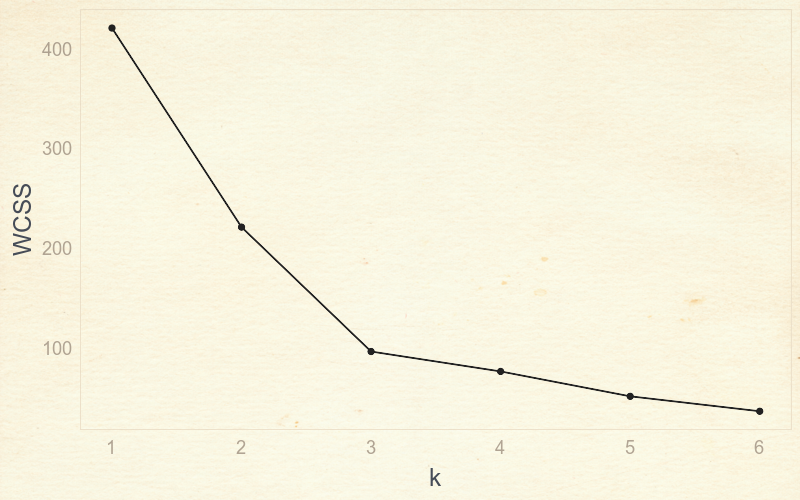
This is called an elbow plot because we can find an optimal k value by finding the “elbow” of the plot, which is at 3. Until 3 you can notice a huge reduction in variation, but after that, the variation doesn't go down as quickly.
And that’s about it. A simple, but effective classification algorithm!
Feel free to connect with me on LinkedIn and send me suggestions for any other algorithms that 10-year olds need to understand!
K-Means Clustering: Explain It To Me Like I’m 10 was originally published in Towards Data Science on Medium, where people are continuing the conversation by highlighting and responding to this story.
from Towards Data Science - Medium https://ift.tt/3rKFo1I
via RiYo Analytics


ليست هناك تعليقات