https://ift.tt/3zX27v5 Here’s how data observability helped the data engineering team at a leading auto-insurance provider deliver more rel...
Here’s how data observability helped the data engineering team at a leading auto-insurance provider deliver more reliable data, faster

As organizations continue to ingest more data from more sources, maintaining high-quality, reliable data assets becomes a crucial challenge. That’s why Clearcover implemented end-to-end data observability across ELT and beyond. Here’s how.
The team at Chicago-based Clearcover, a leading tech-driven insurance provider, pride themselves on providing fast, transparent rates on car insurance for customers across the U.S. They also take pride in their data, which they see as a competitive advantage that allows them to deliver on their promise to consumers: to save money while enjoying fast claims, easy payments, and exceptional service.
I recently sat down with Braun Reyes, Senior Data Engineering Manager, to discuss Clearcover’s journey of scaling a self-service data platform while maintaining the trust and quality needed to achieve their data-powered mission — and how they responded when data reliability issues began to arise.
The data landscape at Clearcover
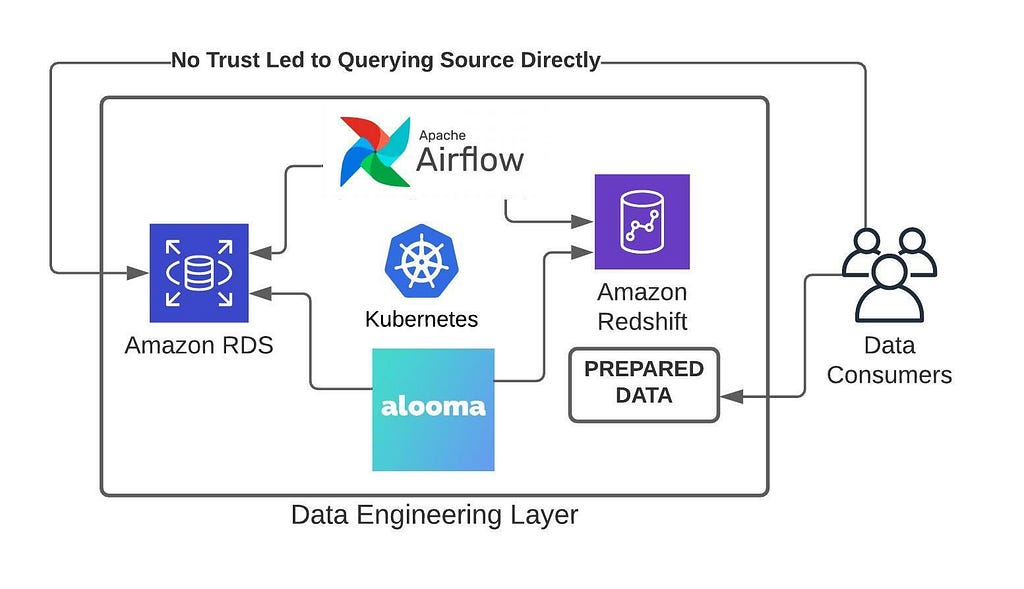
When Braun joined Clearcover, he was a one-man data engineering team — and describes the data stack as a “data for analytics” approach. He was using Amazon RDS on the backend, Alooma for data replication into Redshift, and had an Apache Airflow stack running on Kubernetes. Braun was also responsible for creating prepared data sets.

But with his one-man data engineering team responsible for so many layers, bottlenecks started to crop up. And Braun was spending more time maintaining his tools than actually using them to deliver data. With these bottlenecks and a lack of accessibility to — and therefore trust in — the data, many data consumers found workarounds by simply querying the source data directly.
“All this investment that I was making in this data stack was for naught.”
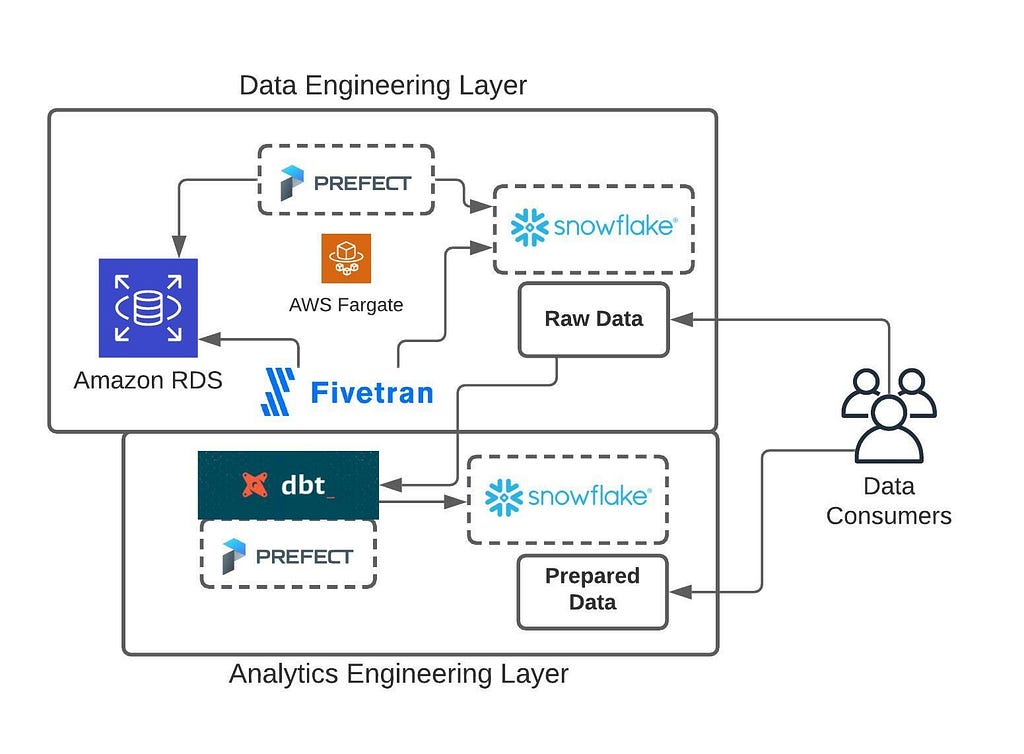
So, as the data engineering team grew, they migrated to a modern, distributed ELT data stack. They switched from Airflow to Prefect and began to use AWS Fargate to lower the total cost of ownership on their compute. The team also uses Fivetran and Snowflake, which provides the accessibility that Redshift lacked for their needs.

Now, the data engineering layer is much smaller and focused on handling raw data, while a separate analytics engineering team takes the tools and the raw data they deliver to produce prepared data for the business — helping eliminate those earlier bottlenecks.
Problem: Lack of trust in the source data
While the distributed data stack made it much easier to integrate more data sources into Snowflake, Braun’s team encountered a new problem: data reliability.
With the proliferation of data sources, it became harder and harder for data engineers to scale data quality testing across pipelines manually. So while they had gained operational trust in their data, they now had to tackle data quality and trust.

“ELT is great, but there’s always a tradeoff,” said Braun. “For example, when you’re replicating data from your CRM into Snowflake, your data engineering team is not necessarily going to be the domain experts on CRM or marketing systems. So it’s really hard for us to tailor data quality testing across all of those sources.”
When data quality issues came up, it was often a surprise to the data engineering team. They would receive Slack messages from their data consumers, asking why a certain table hadn’t been refreshed in days.
“Your pipelines are running, everything looks great, but then you realize that the data you’re delivering is either incorrect or it just hasn’t arrived at all,” Braun said. “You’ve been so focused on the operational aspects of building the pipelines, delivering them, and testing the code that perhaps there wasn’t enough bandwidth to then think about the health of the data itself.”
Braun and his team knew they needed to get a base set of common-sense checks that would provide the coverage required to build data trust. But adding coverage was continually moved down in their backlog, as they were busy dealing with new data sources being requested from the business.
So they began exploring data observability, which allowed users to get visibility and understand the overall health of their data through automated monitoring, alerting, and lineage. For Braun and his team, the concept of measuring data health across the five pillars of observability — freshness, volume, distribution, schema, and lineage — instantly resonated.
“We’re all about simplicity on the data engineering team, and having the problem framed in that way spoke volumes to us.”
Solution: automated coverage across critical ELT pipelines
With data observability in place, providing automated monitoring and alerting of data health issues, Braun and his team had instant base coverage for all of their tables.
“We no longer had to tailor specific tests to every particular data asset.”
Critical step: reducing alerting white noise with dbt artifacts
With over 50 sources providing an enormous quantity of data, Braun also wanted to make sure that his team wasn’t getting alerted and being distracted by data incidents that didn’t actually matter to the business.
To reduce this noise from automated monitoring, they built automation around parsing out dbt artifacts to determine which raw tables were being used by the prepared data package. Then, they built automation around tagging those tables and forwarding incidents related to those key assets to a dedicated channel.“We want to focus our attention on those things that are being used by the business,” said Braun.
“By isolating these Key Assets in a specific Slack channel, it allows my team to just focus on those particular incidents.”
Right away, this monitoring strategy made an immediate impact. Braun’s team was able to proactively identify those silent failures, initiate the conversation with stakeholders, and get ahead of problems faster — instead of receiving panicked Slack messages about missing or incorrect data from analytics or business teams.
Braun and his team were also able to begin preventing data issues from impacting the business.
“For example, we’re not domain experts in Zendesk,” Braun said. “But if we were alerted that some schema from that data source changed from number to string, we can reach out to the BI team and notify them so that when their prepared data package runs in the morning, they won’t run into any downtime.”
Solution: end-to-end lineage speeds up time to resolution for data incidents by 50 percent
Data observability also delivers automated lineage, giving the data team full visibility into upstream and downstream dependencies from ingestion to their BI dashboards. This helps the data engineering team understand the impact of schema changes or new integrations, and makes it much simpler to conduct root cause analysis and notify relevant stakeholders when something goes wrong.
Lineage also helps data engineers see potential downstream impacts and uncover hidden dependencies. Then, they’re able to reach out to anyone who may be running queries on that data or pulling it into Looker reports.
Solution: Using code to extend, automate, and customize monitoring as the data ecosystem evolves
The Clearcover data team makes use of data observability to extend lineage and monitoring through code. Braun and his team can write custom monitoring scripts and build automation easily within their CI workflow to add more relational information and context.
“We do have pipelines and processes that are custom-built or have something like JSON schema that needed extra coverage beyond what the out-of-the-box machine learning monitors provide,” Braun said. “So we can add custom field health monitors that provides more context and even delivery SLAs to our most important and complex assets and pipelines.”
With these custom monitors layered on top of the automated ones, it makes it easy for the data team to set new SLIs and keep closer tabs on SLAs. “With these JSON schema monitors, again, it gives us the ability to apply common sense data quality to JSON variants, initiate the conversation, and keeps us in the loop on any potential incidents that could cause downtime.”
Outcome: 70 percent greater quality coverage across the data lake
After implementing data observability, Clearcover saw a 70% increase in quality coverage across all raw data assets. That led to more proactive conversations, faster root cause analysis, and a reduction in data incidents. And integrating data from over 50 sources is no longer an issue for the team — they know they’re covered when duplications or other anomalies arise.
“Now, we can start having those proactive conversations to prevent downtime before stakeholders are affected, versus finding out after the fact that something was broken and then rushing to get it fixed,” said Braun. “So at least that data can still get out by the end of the day.”
While the team had been considering building their own root cause analysis and anomaly detection tooling, they never were able to prioritize it due to the data engineering resources required. With data observability, they have a vehicle for both, without adding tech debt and reducing the need for custom code.
What’s next for data at Clearcover?
Braun hopes to drive wider adoption of data observability beyond the data engineering team, extending its usage to the analytics engineering team and even savvy business users. And he believes that by adopting data observability across their organization the level of trust in data will only increase.
Curious how data observability can help your organization achieve data quality coverage and build data trust across teams? Reach out to Barr Moses to learn more.
This article was co-written by Will Robins.
How Clearcover Increased Quality Coverage for ELT by 70 Percent was originally published in Towards Data Science on Medium, where people are continuing the conversation by highlighting and responding to this story.
from Towards Data Science - Medium https://ift.tt/3K13ZYh
via RiYo Analytics

No comments