https://ift.tt/3JSBUCi Exploring Large Collections of Documents with Unsupervised Topic Modelling — Part 1/4 Interpreting extracted topics...
Exploring Large Collections of Documents with Unsupervised Topic Modelling — Part 1/4
Interpreting extracted topics with the help of topic modularity
In this series of posts, we will be focusing on exploring large collections of unlabelled documents based on topic modelling. We will assume we know nothing about the contents of the corpus, except the corpus’ context. Our aim is to finish the exploration with some new, quantified knowledge about what is discussed in the corpus.
This is the 1st out of the 4-part series. Let’s get into it.
Introduction
Topic modelling 101
Throughout this series, topic modelling is the baseline of our analysis. For a given corpus, a topic model estimates a topic distribution for each of its documents (i.e., a a distribution of weights over a set of topics), where a topic is itself a distribution of weights over the vocabulary of the corpus. The most weighted words of each topic are syntactically and/or semantically related, given that collection of documents. This means that two distinct topics share the exact same vocabulary, but have different weight distributions.

The problem
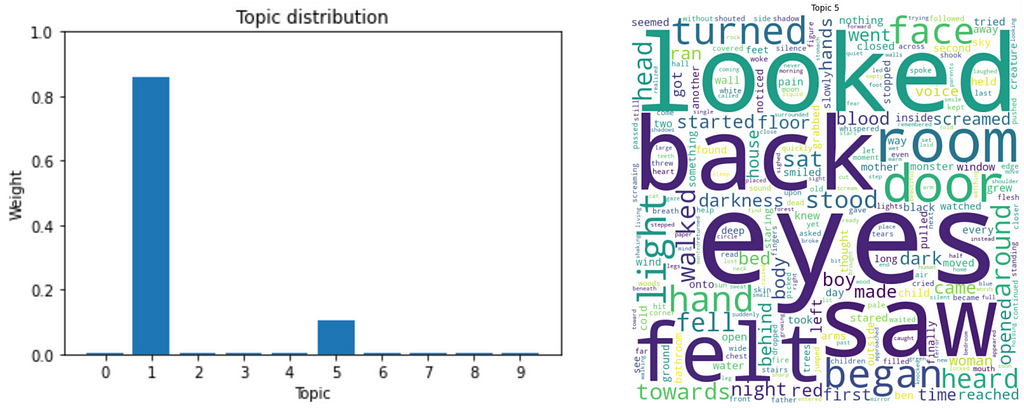
As it can be judged from the image above, although the idea of topic modelling sounds charming, it is often very hard to converge on a coherent interpretation of the results of such a model — remember, we know nothing about the contents of the corpus!
This series of posts will present experimental setup designs that will guide us towards a rational interpretation, backed up by their results.
Proposed solution
In this 1st part, we will take advantage of 2 tools to take a step forward in interpreting the results of a topic model: (1) topic interpretation, and (2) topic modularity.
Implementation
Corpus
Our collection of documents consists of 1904 short, scary stories extracted from the r/shortscarystories subreddit. If you want to learn how to extract these and others yourself, read my post detailing the whole process. This data was collected using Reddit’s API (PRAW) and PSAW, according to Reddit’s terms of use.
Let’s assume the text has been adequately preprocessed and words in a document are separated by a single whitespace.
Estimating distributions
The basis of our analysis will be the results of LDA topic modelling, in this specific case, with 10 topics (arbitrarily determined, for now). We will be using the Sci-Kit Learn implementation:
In the code above, the variable tf (stands for term-frequency) is a numpy matrix of shape (D, V), where D is the number of documents in the corpus, and V is the size of the vocabulary. Each entry tf{d, v} is the frequency of term v in document d. This must be the input to the LDA model.
The output variable doc_topic is of shape (D, K), where K is the number of topics. According to LDA, each row of doc_topic sums to 1.
The attribute model.components_ is of shape (K, V), representing the topic weight distribution over the vocabulary. Again, each row sums to 1.
Topic interpretation
These are the top-10 most weighted words of each of the 10 topics, estimated in the previous section:

As we stated before, a topic is only a distribution of weights over the same vocabulary, thus, limiting ourselves only to the top-10 most weighted words of each topic will allow us to focus on the core concept. However, in this depiction, we cannot grasp the relative weight between words, which could be indicative of the concept being conveyed.
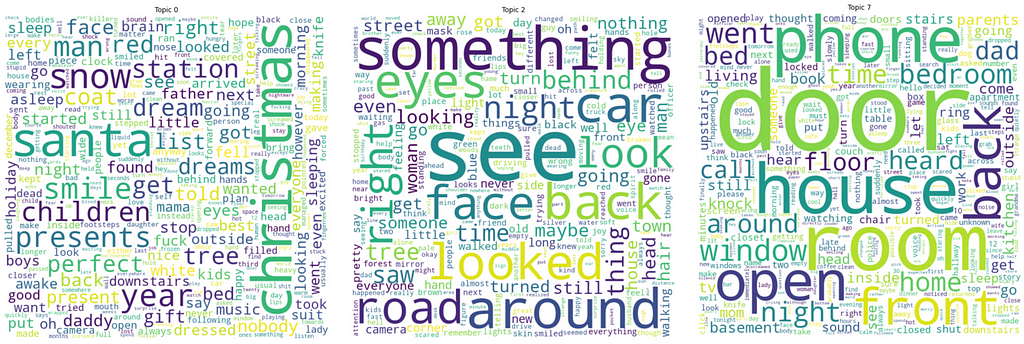
These are the wordclouds of topics 0, 2, and 7:

Take a few minutes to read each of the 10 topics, and try to interpret the concept they may represent. Was it easy to interpret all of them? Or were some more difficult than others?
Which one did you find the easiest to interpret? There are no wrong answers (or right answers, for that matter), but I could bet it was topic 0, and the concept would be something related to “Christmas”. I would personally also label topic 2 as “suspicious observation”, topic 7 as “object/location of interest”, topic 8 as “family members”, and topic 9 as “suspicious subject”. The remaining topics give me a hard time interpreting them.
It is clear that topic interpretation is a very hard task. If now I were to write on a report that this and that topics are easily interpretable and that the labels above could be assigned, and these and those topics aren’t, it wouldn’t sound very scientific. I need to back up those claims with something quantifiable. That is where topic modularity comes into play.
Topic modularity
A topic may convey a certain concept. However, when observing the top-N words of that topic, the latent concept may not be concrete nor comprehensive. However, a topic that does not share a single word (from the top-N) with the remaining topics, may define a concrete, modular concept. Arriving at that concept, in turn, allows for an independent evaluation of the projected documents on that dimension.
For example, because topic 0 is so easy to interpret as “Christmas”, one can hypothesise that it concretely represents that time of the year. This allows us to further hypothesise that all documents that have a large weight on topic 0 must have some reference to Christmas time. Even more, because we know the context of the corpus, we can state that these documents are scary stories set during Christmas.
Here is an example supporting our hypothesis:

This seems like a promising step in the right direction to better understand our corpus! We just need to apply the same technique to every “concrete” topic. Leaving subjectivity behind, topic modularity allows us to state which topics are more concrete than others.
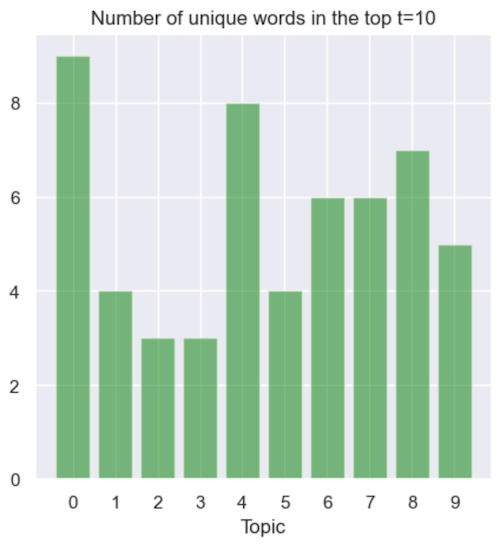
We evaluate topic modularity by determining the number of words shared between all topics extracted by one model (given the top-N most weighted words of each topic). Therefore, we are most interested in the topics with most unique words, however taking into consideration that the probability of choosing K sets of N unique words from the vocabulary is not zero. Thus, the discussion around these results cannot be independent of the actual top words of each topic.
Here is the code:
And here are the results:

Not so coincidently, topic 0 has the highest score in topic modularity. This metric confirms that, indeed, it was the easiest to interpret (or assign a label to).
Let’s move on to the second highest score, topic 4. Even though it has a high topic modularity score, it is still very hard (for me, at least) to interpret it. I can’t quite assign a specific label to it. This serves to show that, on its own, topic modularity is not enough of an evaluation — it must always be accompanied by the actual words of the topic.
Next in line are topics 7 and 8, to which I assign the labels “object/location of interest” and “family members”, respectively. Let’s take a look at a couple of documents with high weights on these topics to support these statements:


Again, topic modularity gave us the confidence and the right intuition. Indeed, both example documents which have high weights on topics 7 and 8 make reference to “object/location of interest” and “family members”. Even further, none of them make reference to Christmas, which is reassuring because they both have zero weight in topic 0.
Conclusion
In this 1st part, we took advantage of 2 tools to take a step forward in interpreting the results of a topic model on an unlabelled corpus: (1) topic interpretation, and (2) topic modularity.
We saw that it can be very subjective to interpret topics, in our case, those of LDA. In a very initial step, assisted by the metric of topic modularity, we were able to objectively state which topics were more concrete and assign a label to them.
Starting from a completely unknown corpus of short, scary stories, we can now claim the following:
- Some scary stories are set during Christmas time, or are in some way related to that time of the year.
- Some scary stories involve family members.
- Some scary stories involve objects or locations of interest.
- We know which scary stories have these characteristics, and quantify exactly how much of these characteristics they have:
→ 0.5% of all stories have more than 0.5 weight in topic 0 — Christmas;
→ 2.3% of all stories have more than 0.5 weight in topic 7— object/location of interest;
→ 4.7% of all stories have more than 0.5 weight in topic 8— family members. - We can state if a given story is more related to any of these characteristics than any other story by the same quantification.
This has been the first, initial step in understanding our corpus. Even though we already gained a lot of information, more steps are needed to arrive at something palpable.
Next part
In the next part of this series we will study more deeply the topic distribution of the documents by learning how they are clustered in the topic space. This will allow us to state how many different groups of scary stories there are, and what they are talking about.
Exploring large collections of documents with unsupervised topic modelling — Part 1/4 was originally published in Towards Data Science on Medium, where people are continuing the conversation by highlighting and responding to this story.
from Towards Data Science - Medium https://ift.tt/3F4FGoS
via RiYo Analytics

No comments