https://ift.tt/33frH23 A beginner’s guide Photo by Mulyadi on Unsplash What is anomaly detection? Anomaly detection also known as ou...
A beginner’s guide

What is anomaly detection?
Anomaly detection also known as outlier detection is the process of finding data points within a dataset that differs from the rest. Common applications of anomaly detection includes fraud detection in financial transactions, fault detection and predictive maintenance.
Broadly speaking, anomaly detection can be categorized into supervised and unsupervised realm. Supervised anomaly detection requires labelled dataset that indicates if a record is “normal” or “abnormal”. Unsupervised anomaly detection involves an unlabeled dataset. It assumes that the majority data points in the unlabeled dataset are “normal” and it looks for data points that differs from the “normal” data points.
In this article, we will be using Pycaret for detecting anomalies. Pycaret is an Automated Machine Learning (AutoML) tool that can be used for both supervised and unsupervised learning.
Unsupervised Anomaly Detection
Let’s start by installing PyCaret.
pip install pycaret==2.3.5
pip install scipy==1.4.1
Import the necessary modules
from pycaret.anomaly import *
from sklearn.datasets import load_breast_cancer
Load the dataset
We will be using the Wisconsin Breast Cancer (Diagnostic) dataset[1] from UCI Machine Learning Repository[2] which contains features computed digitized image of a fine needle aspirate of a breast mass and the diagnosis if the mass is benign (B) or malignant (M). This dataset commonly used for demonstrating supervised machine learning where a model is trained to predict the diagnosis. For the purpose of demonstrating unsupervised anomaly detection, we will ignore the diagnosis.
We split the data into the training set reserve a small “unseen” set for scoring.
df = load_breast_cancer(as_frame=True)['data']
df_train = df.iloc[:-10]
df_unseen = df.tail(10)
Set up Pycaret
anom = setup(data = df_train,
             silent = True)
Setting the silent parameter to True automatically confirms the input of data types when setup is executed. If silent is set to False, Pycaret requires the user to do manual confirmation of the input data types as shown in the image below.
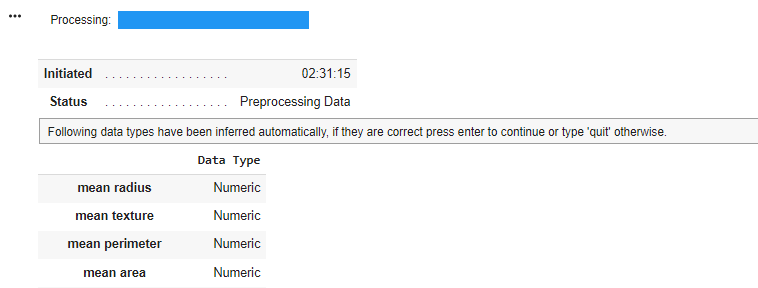
Pycaret will infer the data type if they are not explicitly defined. We can also define which columns contain categorical, numeric, ordinal and date features using the categorical_features ,numeric_features ,ordinal_features parameters. Defining the different data type will affect how the column is being pre-processed. For example, the categorical_imputation parameter determines how missing categorical values are being handled with. The available options are constant and mode. Similarly for numeric features, the numeric_imputation parameter determines how missing numeric values are being handled. The available options are mean, medianor zero.
There is a wide range of other pre-processing options such as normalization, dimension reduction and even custom transformation. Check out the documentation for more details.
Check available models
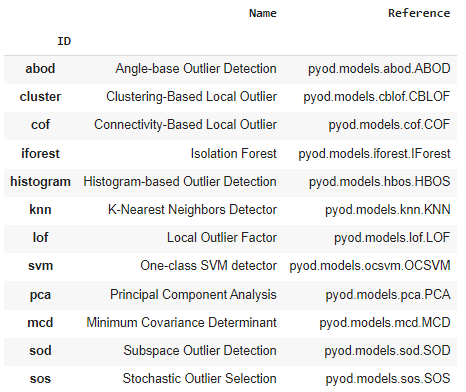
Let’s check what anomaly detection models are available in Pycaret.
models()
The reference column indicates which source package the model was built from. PyOD (Python Outlier Detection) is a package that offers wide variety of outlier detection models.
Train the anomaly detection model
anom_model = create_model(model = 'iforest', fraction = 0.05)
We train an anomaly detection model by defining the model’s ID. The fraction parameter indicates indicates the amount of outliers present in the dataset. The default value is 0.05 which indicates that the dataset has 5% of outliers.
Score the dataset
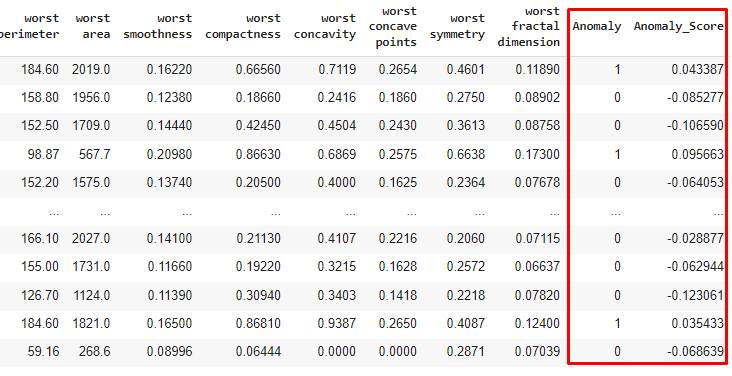
results = assign_model(anom_model)
assign_model scores the training dataset using the trained model and returns the prediction of the model, concatenated with the training data. The Anomaly column is binary where 1 indicates that the record is anomalous and 0 indicates that it is normal. The Anomaly_Score column gives the raw score for the record, where negative indicates that the record is normal.
Plot model
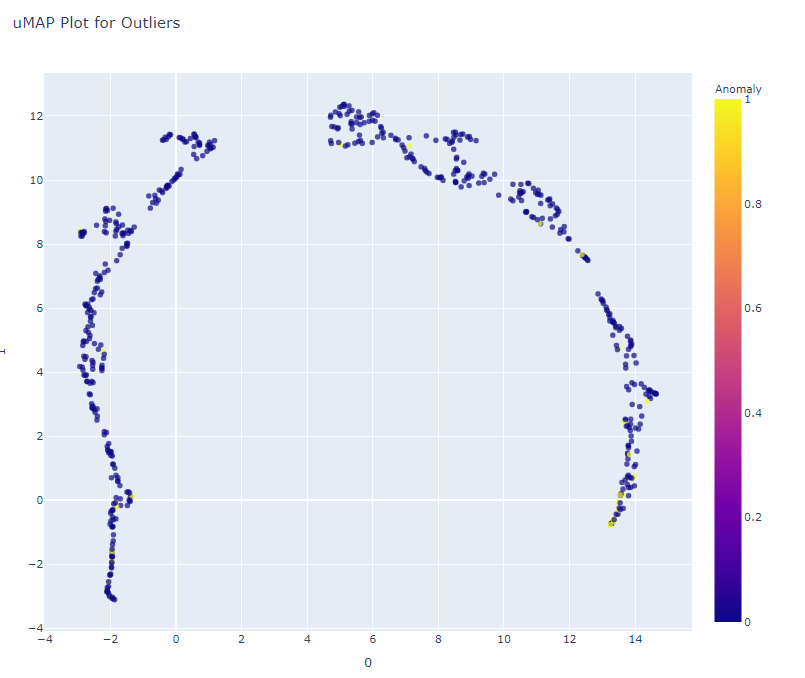
The plot_model function helps to visualize high dimension data using TSNE or UMAP.
plot_model(anom_model, plot = 'tsne')
plot_model(anom_model, plot = 'umap')
Save the model
save_model saves the transformation pipeline and the trained model as a pickle file. The pickle file contains a scikit-learn pipeline object.
save_model(model = anom_model, model_name = 'iforest_model')
Load the model
load_model loads the saved transformation pipeline and trained model as a scikit-learn pipeline object.
loaded_model = load_model('iforest_model')
type(loaded_model)
>> sklearn.pipeline.Pipeline
Score on unseen data
The predict method will get us the a binary output of 1 or 0 where 1 represents an abnormal record and 0 represents a normal record.
loaded_model.predict(df_unseen)
>> array([0, 0, 0, 0, 0, 1, 0, 0, 1, 0])
The predict_proba method will get us the probability of a record being classified as 0 or 1 .
loaded_model.predict_proba(df_unseen)
>> array([[0.81527091, 0.18472909],
       [0.88219213, 0.11780787],
       [0.4789605 , 0.5210395 ],
       [0.46277058, 0.53722942],
       [0.47638085, 0.52361915],
       [0.4421625 , 0.5578375 ],
       [0.68153289, 0.31846711],
       [0.75207438, 0.24792562],
       [0.27120702, 0.72879298],
       [0.54821746, 0.45178254]])
The decision_function method will return us the anomaly score
loaded_model.decision_function(df_unseen)
>> array([-0.11826784, -0.14024322, -0.00783128, -0.00251488, -0.00698418,
        0.00425233, -0.07435137, -0.09751556,  0.06039016, -0.03057366])
Conclusion
In this article we explored how to quickly train an unsupervised anomaly detection model using Pycaret, visualize the high dimension features using TSNE or UMAP and use the trained model to predict on unseen data.
Reference
[1] Breast Cancer Wisconsin (Diagnostic) Data Set
Creators:
1. Dr. William H. Wolberg, General Surgery Dept.
University of Wisconsin, Clinical Sciences Center
Madison, WI 53792
wolberg ‘@’ eagle.surgery.wisc.edu
2. W. Nick Street, Computer Sciences Dept.
University of Wisconsin, 1210 West Dayton St., Madison, WI 53706
street ‘@’ cs.wisc.edu 608–262–6619
3. Olvi L. Mangasarian, Computer Sciences Dept.
University of Wisconsin, 1210 West Dayton St., Madison, WI 53706
olvi ‘@’ cs.wisc.edu
Donor: Nick Street
License: CC BY 4.0
[2] Dua, D. and Graff, C. (2019). UCI Machine Learning Repository [https://ift.tt/SdYWce]. Irvine, CA: University of California, School of Information and Computer Science.
Unsupervised Anomaly Detection in Python was originally published in Towards Data Science on Medium, where people are continuing the conversation by highlighting and responding to this story.
from Towards Data Science - Medium https://ift.tt/31MMgCU
via RiYo Analytics


No comments