https://ift.tt/3k0Ts44 Why Should I Pay for Anomaly Detection? Isn’t It Easy to Build Ourselves? Three key approaches to building a succes...
Why Should I Pay for Anomaly Detection? Isn’t It Easy to Build Ourselves?
Three key approaches to building a successful anomaly detection system working with business performance data

Building Anomaly Detection systems might seem straightforward, but it takes more than asking your Data Science team to implement an off-the-shelf algorithm — all the supporting infrastructure is critical to the system being a success for end users.
In this guide, I’ll lay out 3 key approaches to building a successful Anomaly Detection system working with business performance data, and what core components are required.
Different strokes, for different folks
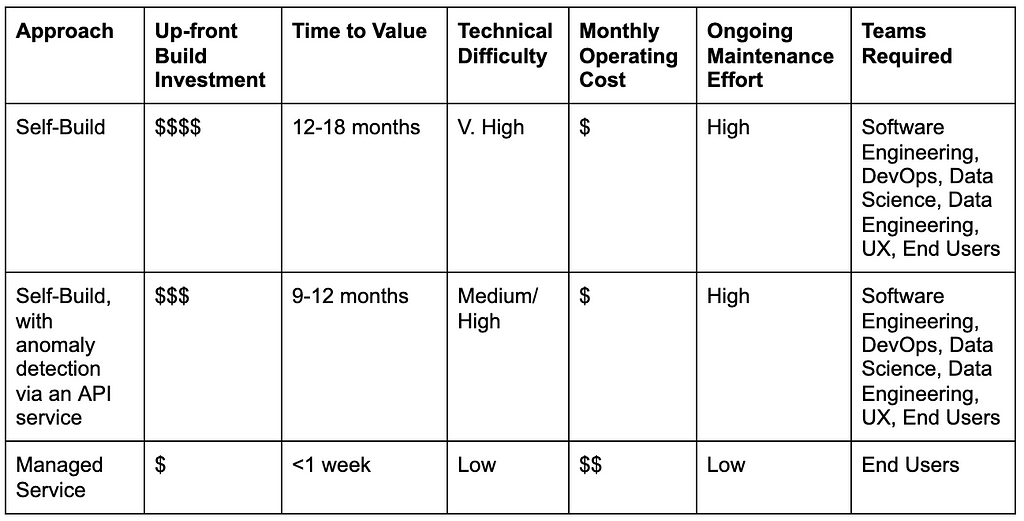
There’s a plethora of approaches to tackling time-series anomaly detection for business metrics. Depending on your team & its needs, you might have considered one of the following approaches already:
- Self build — where you host the anomaly detection algorithm & logic on your own infrastructure, and build all the surrounding apparatus to run detection, as well as maintain the system with internal staffing & resources. Typically, this has a longest time to value, the highest up-front cost, and the highest demand on team time.
- Self-Build, with detection via an API service — same as self-build, but using an API service for the anomaly detection logic, which takes in time-series data and returns results. You would still need to build and maintain all the associated infrastructure outside of this going forward.
- Managed Service — all aspects are hosted and managed by your provider. You simply provide the data and choose what to track, using their SaaS offering. This is typically fastest to value, incurring modest ongoing costs, offset by little time spent on maintenance by the team.
Each approach has its own advantages and drawbacks when it comes to cost, time-to-value and technical difficulty:
What do I need, beyond an algorithm?
Regardless of which approach you take, these are the elements & tasks involved in a successful deployment of a basic Anomaly Detection System — I’ve also provided a realistic indication of how long each component might take to develop, and the skills needed:
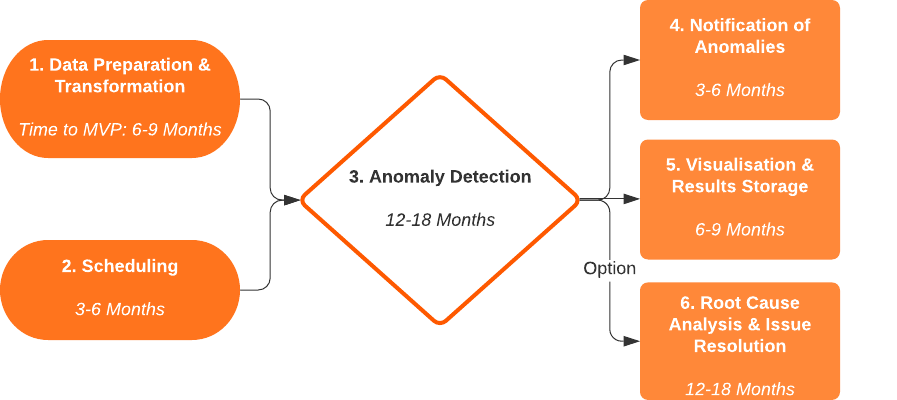
1. Data Preparation & Transformation
Teams: Data Engineering, Software Engineering
Time to Value: 6–9 Months
Stored business performance data needs to be transformed into time-series format suitable for anomaly detection — this involves:
- Establishing data feeds into data storage systems, and a direct coupling into the anomaly detection algorithm, wherever that is hosted
- Defining metrics to be tracked & generating time-series at the desired frequency, based on these metrics
- Account for & remove any incomplete periods, missing values and other data hygiene considerations
- Repeat this hundreds/thousands of times, reflecting user preferences for what to track, in detail
2. Scheduling Anomaly Detection Runs
Teams: DevOps, Software Engineering
Time to Value: 3–6 months
Infrastructure must be built and maintained to regularly trigger the subsequent anomaly detection process — new data is expected to arrive regularly. For maximum efficiency, different metrics should be tracked at different frequencies (e.g. monitor sales hourly, but only check new customer sign ups daily)
3. Anomaly Detection
Teams: Data Science, Software Engineering
Time to Value: 12–18 months
This is the component that comes to mind when most think about anomaly detection — the clever algorithm that identifies unusual behaviours in business metrics. Core tasks include:
- Seamlessly accepting inputs from a wide range of time-series — regardless of frequency, noise, and shape — from the data preparation stage, and scale to handle hundreds/thousands of metrics being tracked concurrently.
- Optimise settings to maximise detection accuracy, whilst minimise the amount of false positives and false negatives, with almost zero human input — not all algorithms offer the same performance
- To reach a high level of performance, with an acceptable level of false positives/negatives, it may well take more than 12 months!
- Clearly output detected anomalies for follow-up actions
4. Notifications Delivery & Task Assignment
Teams: DevOps, Software Engineering, UX
Time to Value: 3–6 months
Once anomalies have been detected, business users need to be notified. Without this step, the anomalies are simply hidden in the system and not visible. Common channels to integrate with include:
- In-App pop-ups
- Email messages
- Workplace chat tools (e.g. Slack, Microsoft Teams)
- Webhooks (for delivery into incident management systems like OpsGenie, PagerDuty)
Also important is the ability to share notifications with other individuals in the business, who may not have received the same alert, and assign tasks for them to resolve the problem at hand.
5. Visualisation & Results Storage
Teams: Software Engineering, UX
Time to Value: 6–9 Months
Whilst having a notification is useful, business users will likely wish to explore other anomalies that have also been identified, in a more free-form fashion. This is best done by visualising detected anomalies in a graphical format, allowing users to:
- Cross-reference the anomaly they have been notified of, against the historical context
- Find other similar anomalies, or investigate other metrics that may also be affected
- Begin to understand the root cause behind a change in performance
- For acceptable speed on access, this requires the results of the anomaly detection algorithm to be stored in a data lake/warehouse.
6. Root Cause Analysis and Issue Resolution
Teams: Data Science, Software Engineering, UX, DevOps
Time to Value: 12–18 Months
Once an anomaly has been identified, it’s natural to try and find out why it happened. Without this feature, business users are limited in their ability to act on the detected anomalies rapidly. Whilst manual analysis into a dataset is possible, this requires skills that are not the focus of business users, and could take hours or days to perform.
Automated root cause analysis systems using machine learning help surface the most relevant reasons for changes in performance, as identified by anomalies. This is typically done within seconds, and involves:
- Developing the underlying root cause analysis algorithm, flexible enough to answer any question based on metrics and identified anomalies, and compare to normal behaviour.
- Explaining changes in trends.
- Minimising irrelevant reasons behind performance changes, e.g. coincidental correlations
- Displaying this information in an easy to interpret way, where business users can explore additional reasons and quickly share these insights with others to resolve the issue.
To Summarise:
Anomaly detection for business performance metrics is about more than the detection algorithm — all the supporting components help make the system & its insights accessible & useful for business users, and the choice of approach has real implications for cost & time-to-value!
I hope this has been a useful guide in your journey to implementing anomaly detection for your business — if you’d like to check out Avora’s approach, visit us at www.avora.com!
Why should I pay for Anomaly Detection? Isn’t it easy to build it ourselves? was originally published in Towards Data Science on Medium, where people are continuing the conversation by highlighting and responding to this story.
from Towards Data Science - Medium https://ift.tt/3GE6iPk
via RiYo Analytics


No comments