https://ift.tt/3xlfALN Develop maintainable projects from Jupyter A detailed guide to convert a Jupyter notebook into a modular and mainta...
Develop maintainable projects from Jupyter
A detailed guide to convert a Jupyter notebook into a modular and maintainable project.
Over the last few months, we’ve talked to many data teams to help them get started with Ploomber to develop maintainable and production-ready pipelines. One question that often comes up is, How do we refactor our existing notebooks? This blog post series provides a step-by-step guide to convert monolithic Jupyter notebooks into maintainable pipelines.
To ensure you know when the second part is out, follow us on Twitter or susbcribe to our newsletter. Let’s get started.
Introduction
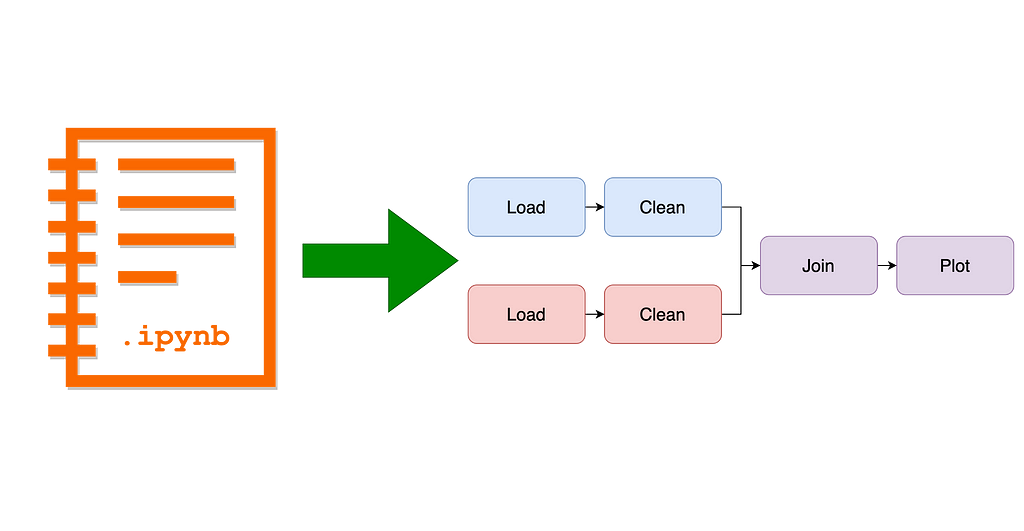
Code that lives in a .ipynb gets real messy fast. Thus, after a few days of the notebook's creation, it's common for such files to contain hundreds of cells and dozens of tables and plots.
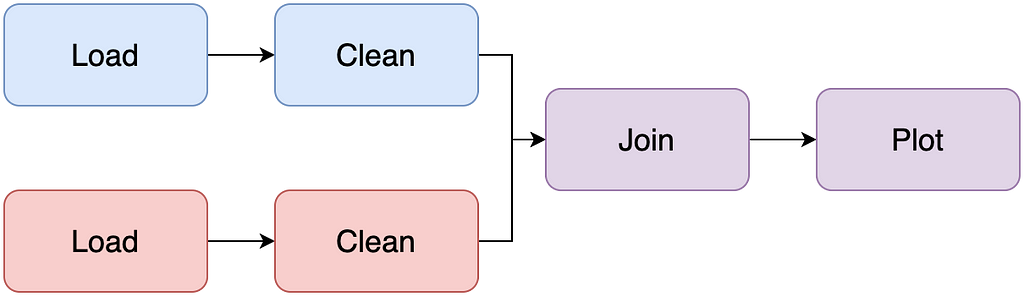
Such a notebook is what we call a Jupyter monolith: a single notebook that contains everything from data loading, cleaning, plotting, etc. Unfortunately, maintaining a Jupyter monolith is extremely hard because there aren’t clear boundaries among tasks, and there isn’t an easy way to test parts in isolation. So our objective is to turn a messy notebook into something like this:
Step 1: Ensure the notebook runs
Say your project currently looks like this:
This file layout is typical: .py files may contain some utility functions, but most of the code lives in the analysis.ipynb notebook. Before refactoring our code, let's first add two files that will help us test our pipeline:
- Dependencies:requirements.txt
- Ploomber pipeline specification: pipeline.yaml
If you already have a requirements.txt, use it. Otherwise, create a file with the following content:
Your pipeline.yaml should look like this:
Then, add the following as the top cell in your notebook:
And tag such cell with parameters. Click here for instructions on cell tagging.
At this point, your project looks like this:
Now, let’s create a virtual environment and run our pipeline. The exact steps for creating a virtual environment depend on the package manager you’re using and the virtual environment manager; here’s some sample code if using pip and on Linux/macOS:
The pipeline will likely crash due to missing dependencies (i.e., you’ll see a ModuleNotFound error). So first, install any missing dependencies using pip install {name} and add a new line with the package name to requirements.txt; try again until the pipeline runs.
Our requirements.txt file contains the list of dependencies we need to run our project. Still, it doesn't specify particular versions; consequently, running pip install -r requirements.txt today and running it one month from now will yield a different set of dependency versions (e.g., pandas 1.2 vs. pandas 1.3), potentially breaking our pipeline. To prevent that, execute the following:
pip freeze prints an exhaustive list of dependencies with their corresponding versions. The next time you run your pipeline, you can do pip install -r requirements.lock.txt to get the same environment that you currently have. Make sure you re-generate requirements.lock.txt whenever you modify requirements.txt.
If you got rid of ModuleNotFound errors, but you still see other types of errors, your pipeline is likely broken due to different reasons. So let's move to the next stage to fix that.
Step 2: Smoke testing with a data sample
Data pipelines tend to be long-running processes that may take hours to run. To accelerate the debugging process, we make it fail quickly, fix errors, and repeat.
To enable quick testing, first, add a new variable to your parameters cell in the analysis.ipynb notebook:
And add a new parameter to your pipeline.yaml:
We want the sample parameter to control whether to use the entire dataset or a sample. Now, locate all the cells in the notebook that are loading or downloading raw data, for example:
And use the sample parameter there:
You can reproduce many bugs in a data pipeline with a portion of the data. The objective here is to speed up execution time to remove those bugs faster. Now that our pipeline runs with a sample by default, let’s rerun it:
To run with the entire dataset, execute ploomber build --help, and you'll see the CLI argument to pass to switch the sample parameter.
Keep running your pipeline with a sample until it executes successfully.
Some advice to solve common incompatibility issues
A common source of error when executing notebooks is that the dependency version used to develop it in the first place (e.g., pandas 1.2) is different from the latest version (e.g., pandas 1.3). If any library introduces API-breaking changes, your pipeline will no longer run. Fixing dependency version issues is a trial and error process, so keep an eye on the types of errors and check the library's documentation to look for changes in the API. If that's the case, downgrade dependencies until you fix the issue:
If you make such a change, remember to generate the requirements.lock.txt file again.
If you cannot trace back the error due to an API change, things will get more complicated, so let’s go to the next step.
Step 3: Fixing broken pipelines
Note: you can skip this step if the pipeline created in Step 1 is running correctly.
The goal of this step is to ensure that your notebook runs from start to finish. Most likely, the project doesn’t contain any tests, so the only reference that you have to know whether the code is doing what it’s supposed to do is the original analysis.ipynb notebook and the recorded outputs.
Open pipeline.ipynb in Jupyter and run it from top to bottom (ensure you turn sample=False to use the entire dataset). Then, on every cell, compare the output (if any) of analysis.ipynb and make sure it matches. Here’s where your judgment comes in because some lines of code may involve random processes (e.g., drawing random numbers); hence, the output won’t match exactly.
Continue until:
- The output doesn’t match, or
- The code breaks
If the code breaks
If a particular cell breaks, execute the following:
The previous command starts a debugging session from the latest raised exception.
%pdb enters the Python debugger; learning how to use it is invaluable for debugging Python code. Ploomber's documentation contains a throughout example to use the debugger in data science projects. If you want to learn each of the available commands when you're in debugging mode, check out the documentation.
Hopefully, by using the debugger, you’ll be able to find and fix the error.
If the output doesn’t match
This scenario is more challenging than the previous one because our code isn’t failing, so we don’t know where to debug. However, you may have some idea of where in the code things are failing; at each of those places, you can start a debugging session.
Say that the failing cell looks like this:
After careful examination, you determine that process_data_frame calls some_function and that the error might be there. So you go to some_function source code and edit it:
Now, When calling process_data_frame(df), which in turn calls some_function(df) and debugging session will start.
Debugging isn’t an easy task but using the debugger a much better than using print statements all over your code. Check out the debugging example in Ploomber's documentation to learn a few tricks on debugging.
Step 4: Convert .ipynb to .py
At this point, you should be able to execute your pipeline from start to finish without errors. This step and the upcoming ones ensure that your pipeline stays maintainable and stable.
Making small commits and testing on each git push is vital to ensure you know whenever your pipeline breaks. Furthermore, it’s much easier to find an issue introduced in a commit that modified ten lines of code than after twenty commits and hundreds of source code lines changed. Unfortunately, .ipynbare hard to manage because they’re JSON files containing code and output. For example, if you have a pipeline.ipynb file, edit a single cell, and commit the new version, you’ll see something like this:
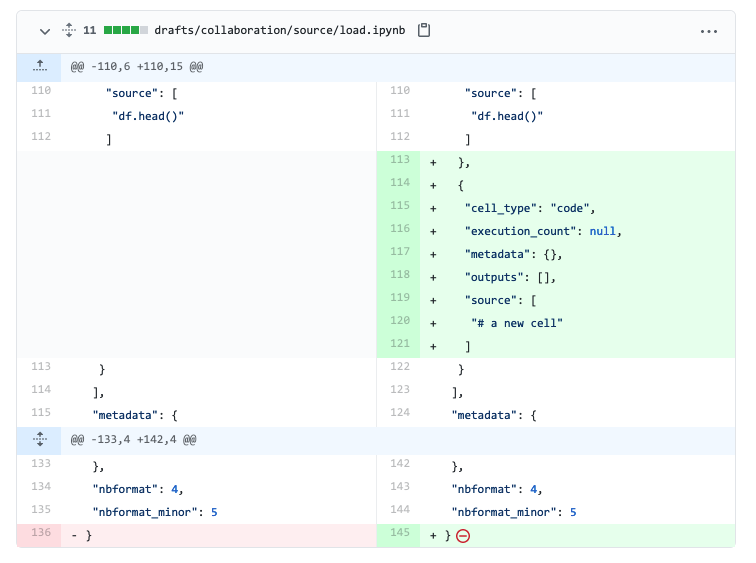
It’s hard to tell what changed with all the clutter. To solve the problem of diffing notebooks, we’ll convert our .ipynb files to .py using jupytext:
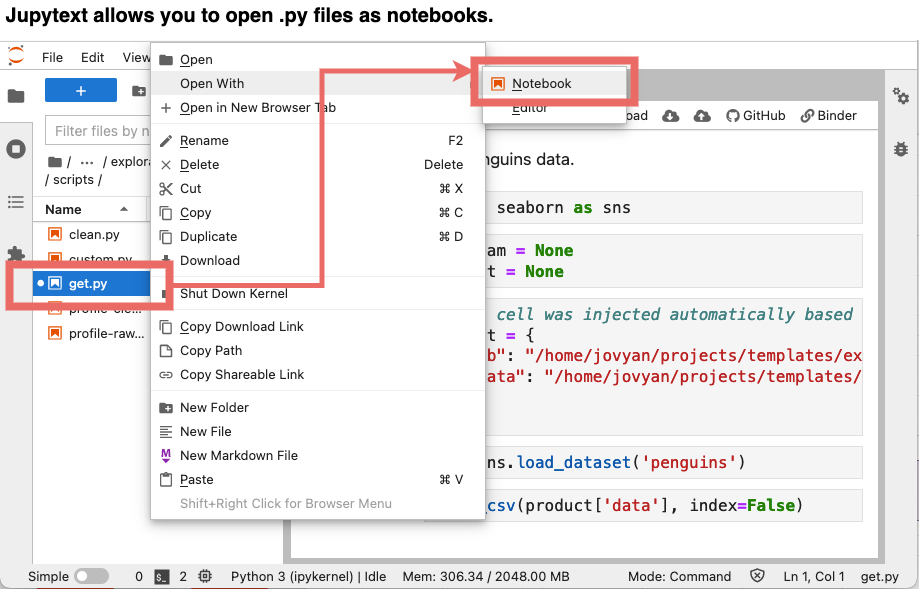
But do not worry! You can still open them as notebooks, thanks to jupytext’s Jupyter plug-in.
Note: Jupytext has many output formats, check out the documentation to learn more.
Once you convert your pipeline.ipynb to .py Update your pipeline.yaml file:
Ensure everything still works correctly:
ploomber build
If the pipeline runs, delete pipeline.ipynb.
Up Next
So far, we’re able to execute our pipeline in a fresh environment: we install dependencies and then execute ploomber build, but our pipeline is still a monolith: all our code is in a single file. In the next part of this series, we'll address this issue and start splitting our logic in smaller steps.
To ensure you know when the second part is out, follow us on Twitter or susbcribe to our newsletter. See you soon!
Found an error? Click here to let us know.
Originally published at ploomber.io.
Refactoring a Jupyter notebook into a maintainable pipeline: A step-by-step guide (Part I) was originally published in Towards Data Science on Medium, where people are continuing the conversation by highlighting and responding to this story.
from Towards Data Science - Medium https://ift.tt/3HTAir2
via RiYo Analytics


ليست هناك تعليقات