https://ift.tt/3qxpIQd Families — What is better than owning Two Electric Cars? We show how a family optimizes both CO₂ emissions and the ...
Families — What is better than owning Two Electric Cars?
We show how a family optimizes both CO₂ emissions and the everyday usability of their vehicle fleet. The solution surprises.

There are already a large number of studies comparing the greenhouse gas emissions and the costs of electric vehicles (also “BEV”) with those of cars based on combustion engines (“ICE”). Less research is done on the optimization of the problem for a community (e.g. family or household) that needs two cars.
To fill this gap, as well as out of self-interest, we have simulated a realistic scenario in detail for this study.
We optimize the following two criteria to arrive at a balanced and feasible solution:
- Climate footprint. CO₂ emissions should be minimized over the entire life cycle (including car and battery production, fuel supply, etc.).
- Everyday usability. Charging and fuelling means loss of time, and some logistics. Therefore, our solution should require only a few days per year to recharge/refuel the vehicle(s) more than once a day.
Since the entire study is a bit more complex, we will roll up everything from the back: first the results and implications, then the assumptions and details of the simulation.
Content
- Result of the study
- Simulation: assumptions
- Simulation: details
- Simulation: results
- The winner
- Summary & Outlook
Result of the study
As promised, we start with the result. Details and assumptions will follow later. Here are the main findings:
- Under realistic assumptions, the best for a family/household is to use one electric car and one diesel car.
- The electric car should always be preferred for daily use if the daily distance is short or if the distance can be covered with a maximum of one recharge.
- Since battery production is CO₂-intensive, the electric car should have rather a small battery (e.g. 45 kWh).
- In contrast to using two electric cars, the need for a second refueling/recharging within one day is drastically reduced (to one hundredth) if one of the cars has a combustion engine.
If an electric car is mainly used for short and medium distances, most of the charging can take place at home in one’s own garage. This saves time and money. For owners of a private photovoltaic (PV) system, CO₂ can be reduced even more.
Another interesting finding:
- The usage of two electric cars, both with a large battery, leads to a rather poor carbon footprint for our scenario.
Are you curious about how we got these results? The next sections will give you an insight into the details …
Simulation: assumptions
For our simulation, we had to make some assumptions. One part of the assumptions are based on literature research, the second part concerns the definition of the scenario under investigation. In any case, the simulation model can be adapted quickly and easily to varying parameters.
In order to achieve comparable results, we base our analysis on vehicles of the compact class. This class also includes the models that currently account for the largest market share in Europe (VW Golf, VW ID.3).

So let’s go through the assumptions one by one:
CO₂ emissions per unit of energy
- 0.468 kg CO₂ per kWh of electricity.
- 3.140 kg CO₂ per liter of petrol.
- 3.310 kg CO₂ per liter of diesel.
The first assumption is based on the European electricity mix “EU2014” (1). Since electric cars do not emit any greenhouse gases while driving, the emissions are exclusively the exhaust gases for energy provision. For a fair comparison, these must not be ignored.
The emissions for the internal combustion engines were also increased by the CO₂ load during fuel production in order to calculate the total emissions (2).
CO₂ emissions for vehicle production and disposal
According to (1), the greenhouse gas emissions for the production of a compact car are as follows:
- 8,110 kg CO₂ for an electric car (BEV).
- 7,425 kg CO₂ for a petrol vehicle
- 7,609 kg CO₂ for a diesel vehicle
For the electric car, an additional 145 kg CO₂ per kWh of battery size is added. A battery with a capacity of 50 kWh thus comes to an additional 7,250 kg CO₂ for the production as well as disposal of the battery.
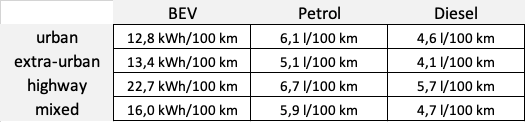
Consumption
For the fuel consumption values, we used the same source (1) in order to remain consistent. Here are the assumptions, in the usual units of liters or kWh per 100 kilometers:
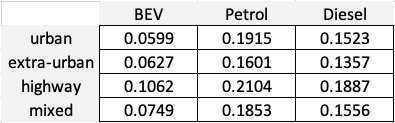
Multiplying the data of the emissions per kWh or km by the consumption already results in the CO₂ emissions per kilometer. This makes it easy to compare vehicle types in the various areas of use (“road types”):
Definition of the scenario
The scenario we simulate roughly represents the typical everyday mobility of a family. We assume that a few longer trips (e.g. holidays) and a large number of smaller trips are made per year.
The following table defines the details of this. The numbers below the road types are so-called “car days”. The number 100 in the first cell below “Innerorts” is interpreted in such a way that on one hundred days per year a vehicle is needed that covers a total distance of 5–10 km, mainly “Innerorts”.
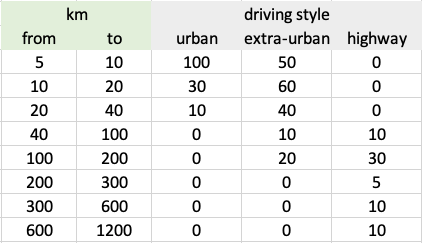
In total, this results in 27,625 km per year, on 385 “car-days”. If the number of car-free days is given as 20 as a further parameter, the days on which exactly one car or both cars are in use are 325 and 40, respectively.
A quick check shows correctly: 20 x 0+ 325 x 1 + 40 x 2= 385.
For our simulation, we can of course adjust all the parameters in this section as desired.
Simulation: details
To get reliable results, we used a so-called “Monte Carlo” simulation. Basically, for a period of 10 years, we randomly determine day by day whether 0, 1 or 2 cars are in use and which daily routes have to be driven.
Using the programming language R, this can be achieved using:
## Decide on 0, 1, 2-car days by Monte Carlo.
nDays = 365 * years
dayType = sample(
 0:2, size=nDays, replace=TRUE,
 prob=carDayDistribution[c("zeroCarDays","oneCarDays","twoCarDays")]
)
A required daily workload of a so-called 2-car day could look as follows, for example:
- Route A: 7 km, urban.
- Route B: 980 km, highway.
With “random” we mean that on average the distribution of the table shown in the scenario section is reproduced. However, after 10 years there can still be more or even fewer highway or urban trips.
Depending on which 2 car types (from BEV, petrol, diesel) the simulation runs through, one or the other car selection will be used for one day.
Our decision criterion (per day) is as follows:
- If there is only one route to be driven, we take the car with the lowest CO₂ emissions. Assuming the daily route can be traveled with a maximum of 1x recharging/fuelling.
Otherwise, we choose the vehicle with the longer range. - If two routes are to be driven, we select the routes for the cars in such a way that the sum of the daily CO₂ emissions is minimized. If one of the vehicles has to recharge or refuel more than once, we assign the longer distance to the vehicle with the longer range.
Btw, we do not assume recharge to happen at 0%, but at 20% ;) Again, we use vectorized code:
## 1-Car-Days.
nOneCar = sum(dayType == 1)
# Get n tracks as a data.frame including driveType and km.
tracks = getTravelRequests(nOneCar, carDaysData)
CO2_carA_track1 = CO2_per_km[tracks$driveType,fuelTypeA] * tracks$km
CO2_carB_track1 = CO2_per_km[tracks$driveType,fuelTypeB] * tracks$km
...
selected_car = ifelse(
  (CO2_carA_track1 <= CO2_carB_track1) & (tracks$km<=rangeA), "A",
  ifelse(
    (CO2_carB_track1 <= CO2_carA_track1) & (tracks$km<=rangeB), "B",
    ifelse(
      rangeA >= rangeB, "A",
      "B"
    )
  )
)
## 2-Car-Days.
nTwoCars = sum(dayType == 2)
...
The rule is thus deterministic and relatively simple. As you can see: a combination of CO₂ minimization, but avoidance of a “continuous refueling day”.
Since the battery size is decisive, we use the following 5 car types:
- BEV with 45 kWh
- BEV with 60 kWh
- BEV with 85 kWh
- Petrol with 55-liter tank
- Diesel with 55-liter tank
By the way, the tank size of the combustion engine does not really play a role in the results.
Simulation: results
For each combination of two vehicle types (even the same type twice), 50 simulations with a duration of 10 years were carried out. The simulation provides us with details about the total CO₂ consumption from the production, use, and disposal of the vehicles. It also gives us the number of “car days” where a single recharge/refuel is not enough.
The table of CO₂ consumption (entire car life) is somewhat surprising. It is clear that 2 petrol cars do badly (69.5t). But 2 BEVs with 2 large batteries are also far behind (66.7t):
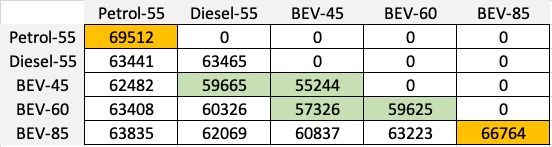
A combination of 2 BEVs is then environmentally friendly if the battery capacity is kept small (60kWh, better still 45kWh). But even a 45 kWh BEV with diesel is still just under the 60 tonnes of CO₂.
But which combinations are suitable for everyday use? That is what the following table tells us. Practically all combinations that include at least one diesel or petrol engine will manage a maximum of one journey requiring more than one recharging/fuelling over the 10 years:
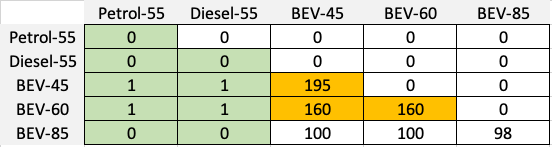
The situation is completely different if you opt for two BEVs. In this case, recharging is necessary much more often, on average between 100 and 200 times within the 10 simulated years — that makes 10–20 times per year.
The winner
Our winner has thus been determined. Only one combination shows a green light in both tables:
If you are looking for a practical solution, you should have a BEV with a small battery (e.g. 45kWh) as well as a combustion engine vehicle (e.g. diesel) in your fleet.
In order to obtain the optimal values, all routes for which the range of the BEV is sufficient should of course be driven with the BEV.
For the winning solution, we naturally want to go into a little more detail, and give additional key figures for one of the 50 simulation runs. In the following table, row 1 shows a summary for car “A” (BEV), and row 2 for car “B” (diesel).

It can be seen that the BEV makes 3293 journeys of 40.6km, whereas the diesel makes 530 journeys of 242km on average.
The BEV produces 8.1t CO₂ for the production of the car, 6.5t for the battery, and 11.0t for the energy supply. In total 25.7t.
Diesel, on the other hand, requires 7.6t CO₂ for the production of the car, a total of 24.0t for exhaust gases and energy supply, making a total of 31.5t.
The sum of the two values is even below the average of the 50 simulations (59.7t). This is due to the nature of simulations that also take into account the scatter.

Summary
My personal learnings from this study:
- The combination of an electric and diesel vehicle achieves the best results for our scenario in terms of climate balance and suitability for everyday use.
- Neither 100% electric nor 100% internal combustion engines yield good results.
- The trend towards large batteries must be viewed critically. If you own a fleet of more than one car, you have many options for optimization. A BEV with a small battery usually improves the climate balance considerably.
Outlook
Many parameters, such as the electricity mix used, fuel consumption, etc., can change quickly. We do not rule out the possibility of updating the existing simulation with modified parameters in the near future.
We are also considering putting the simulation online as a small web application so that everyone can simulate their “own scenario” — and thus derive the best recommendation for action for themselves and for the environment.
Sources
(1) Agora Verkehrswende (2019): Klimabilanz von Elektroautos. Einflussfaktoren und Verbesserungspotenzial.
(2) Auke Hoekstra, innovationorigins (2020): Die Herstellung von Benzin und Diesel verursacht mehr CO2-Emissionen als wir dachten.
Families: what is better than owning Two Electric Cars? was originally published in Towards Data Science on Medium, where people are continuing the conversation by highlighting and responding to this story.
from Towards Data Science - Medium https://ift.tt/30fcD31
via RiYo Analytics


No comments