https://ift.tt/3CPZawa Essential Things You Need to Know About F1-Score Learn about the key fundamentals of F1-score, one of the most impo...
Essential Things You Need to Know About F1-Score
Learn about the key fundamentals of F1-score, one of the most important evaluation metrics in machine learning.

Table of Content
- Introduction
- Precision and Recall: A Recap
- Which is Worse — False Positives or False Negatives?
- Motivation Behind F1-Score
- What is F1-Score?
- Precision, Recall or F1-Score?
- Why Harmonic Mean?
- Conclusion
1. Introduction
F1-score is one of the most important evaluation metrics in machine learning. It elegantly sums up the predictive performance of a model by combining two otherwise competing metrics — precision and recall. This post is written as an extension of my two previous posts on accuracy, precision and recall, and I encourage you to check them out!
In this post, I will cover all the essential things you need to know about F1-score. I will set the context by explaining when to use either precision or recall. Next, I will define F1-score and explain when it should be used. Finally, I will compare the different types of averaging two numbers — including harmonic, geometric and arithmetic means — and discuss why F1-score is based on harmonic mean.
2. Precision and Recall: A Recap
It is not possible to discuss about F1-score without first setting the context with precision and recall. In gist, precision and recall are metrics that help us evaluate the predictive performance of a classification model on a particular class of interest, also known as the positive class.
- Precision: Of all positive predictions, how many are really positive?
- Recall: Of all real positive cases, how many are predicted positive?
Formally, precision and recall are defined as:


3. Which is Worse — False Positives or False Negatives?
So, when should you use precision, and when should you use recall? If you think about it, precision and recall both measure a model’s predictive performance, but in different ways. Precision measures the extent of error caused by False Positives (FPs) whereas recall measures the extent of error caused by False Negatives (FNs). Therefore, to decide which metric to use, we should assess the relative impact of these two types of errors on our use-case. Thus, the key question we should be asking is:
“Which type of error — FPs or FNs — is more undesirable for our use-case?”
Let’s contextualise this by revisiting our cancer prediction example. Figure 1 shows the confusion matrix summarising the hypothethical prediction results. Out of the four scenarios, Scenarios #2 and #3 are undesirable.
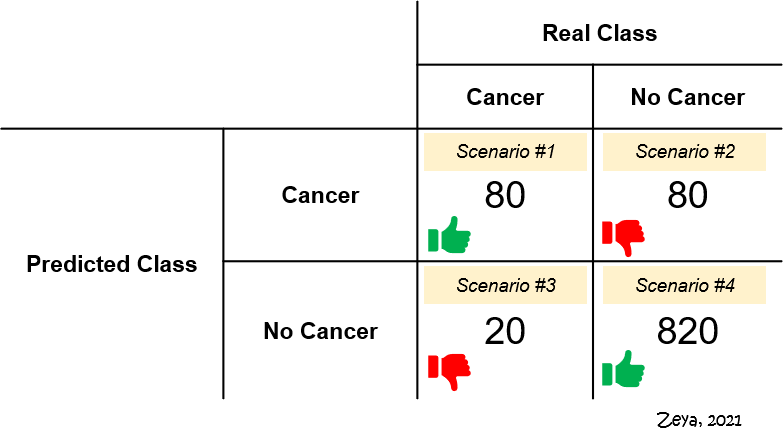
- Scenario #2 represents FPs. Of 900 patients who really do not have cancer, the model says 80 of them do. These 80 patients will probably undergo expensive and unnecessary treatments, at the expense of their well-being.
- Scenario #3 represents FNs. Of 100 patients who really have cancer, the model says 20 of them don’t. These 20 patients would go undiagnosed and fail to receive proper treatment.
Between these two scenarios, which is more undesirable? We could argue that it is Scenario #3. It’s probably worse to not receive any treatment, which could place one’s life in danger, than to receive unnecessary treatment. Since the impact of errors caused by FNs is assessed to be more significant, it makes sense to select a model that has as few FNs as possible. In other words, we should use recall instead of precision.
When should you use precision, then? Many real-world datasets are often not labelled, i.e. we do not know which class each observation belongs to. Is an email a spam or a ham? Is an article fake news or not? Will the customer churn? One of the key benefits of using machine learning to classify in such use-cases is to reduce the amount of human effort required. Thus, for all observations that the model predicts as positive, we would want as many of them to be really positive. In other words, we want our model to be as precise as possible. In such scenarios, precision should be used over recall.
4. Motivation Behind F1-Score
It is also possible that for your use-case, you assess that the errors caused by FPs and FNs are (almost) equally undesirable. Hence, you may wish for a model to have as few FPs and FNs as possible. Put differently, you would want to maximise both precision and recall. In practice, it is not possible to maximise both precision and recall at the same time because of the trade-off between precision and recall.
Increasing precision will decrease recall, and vice versa.
So, given pairs of precision and recall values for different models, how would you compare and decide which is the best? The answer is — you guessed it — F1-score.
5. What is F1-Score?
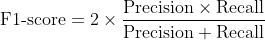
By definition, F1-score is the harmonic mean of precision and recall. It combines precision and recall into a single number using the following formula:
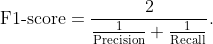
This formula can also be equivalently written as,
Notice that F1-score takes both precision and recall into account, which also means it accounts for both FPs and FNs. The higher the precision and recall, the higher the F1-score. F1-score ranges between 0 and 1. The closer it is to 1, the better the model.
6. Precision, Recall or F1-Score?
Now that we’ve covered the fundamentals, let’s walk through the thinking process of choosing between precision, recall and F1-score. Suppose we have trained three different models for cancer prediction, and each model has different precision and recall values.
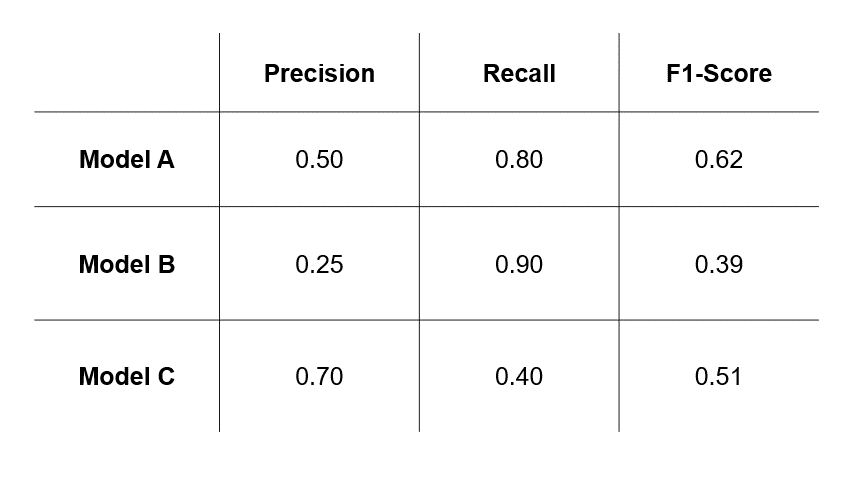
- If we assess that errors caused by FPs (Scenario #2 in Figure 1) are more undesirable, then we will select a model based on precision and choose Model C.
- If we assess that errors caused by FNs (Scenario #3 in Figure 1) are more undesirable, then we will select a model based on recall and choose Model B.
- However, if we assess that both types of errors are undesirable, then we will select a model based on F1-score and choose Model A.
So, the takeaway here is that the model you select depends greatly on the evaluation metric you choose, which in turn depends on the relative impacts of errors of FPs and FNs in your use-case.
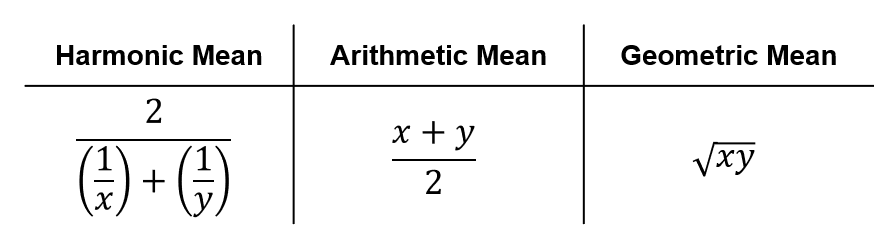
7. Why Harmonic Mean?
I mentioned briefly that F1-score is the “harmonic mean of precision and recall”. What does it mean by harmonic mean? Surely, there are other ways of combining two numbers into one… such as arithmetic mean or geometric mean (see Figure 3 for their mathematical formulae¹).
For more detailed information about harmonic, arithmetic and geometric means, I recommend the following post by Daniel McNichol.
On Average, You’re Using the Wrong Average: Geometric & Harmonic Means in Data Analysis
If you do a Google search on why F1-score uses harmonic mean, you will find answers like “harmonic mean penalises unequal values more” and “harmonic mean punishes extreme values”. I struggled to understand them at first. Since I like to simplify concepts, I created an interactive 3D scatter plot in Figure 4 to help me understand better. Essentially, this 3D scatter plot compares how harmonic, arithmetic and geometric means vary with different sets of precision and recall values. Feel free to play around with it!
p.s. I will not go through the code used to produce Figure 4, since that would be outside the scope of this post, but feel free to check it out at my GitHub repo.
We can make several interesting observations from Figure 4:
- The three types of means are the same if and only if precision and recall are equal. Notice how the red scatter points intersect with the blue and green scatter points only along the diagonal of the precision-recall axis (i.e. when precision = recall).
- Harmonic and geometric means start to become further from arithmetic mean when precision and recall are not equal. While the red scatter points form a flat plane, the blue and green scatter points form curved planes.
- The more unequal precision and recall values are, the lower the harmonic mean, more than geometric and arithmetic means. The plane represented by blue scatter plots for harmonic mean is more “curved” than those for geometric and arithmetic means.

How do we make sense of these observations in a way that is intuitive? Let’s imagine ourselves standing at the highest point of Figure 4, where precision and recall are both equal to 1 and all three types of means are 1. Now, suppose we “walk down” the slopes of the planes along the precision axis, i.e. we hold recall fixed at 1 while reducing precision from 1, to 0.95, to 0.90, to 0.85 and so on until we reach 0.05. As we walk, precision decreases, so do the mean values across all three types of means.
However, it decreases most sharply for harmonic mean since its plane is the most “curved”. At the point where precision is 0.05, we will find ourselves at the lowest point if we are on the plane representing harmonic mean than the other two. Here, arithmetic mean is 0.525 and geometric mean is 0.224, but harmonic mean is only 0.095! Now, it makes more sense to me (and hopefully to you too) what it really means by the fact that harmonic mean “penalises unequal values more” or “punishes extreme values”.
So, why is F1-score based on harmonic mean? Well, it is clear that harmonic mean discourages hugely unequal values and extremely low values. We would want F1-score to give a reasonably low score when either precision or recall is low and only harmonic mean enables that. For instance, an arithmetic mean of 0.525 or geometric mean of 0.224 when recall is 1 and precision is 0.05 probably do not sufficiently convey the fact that precision is very low, as much as a harmonic mean of 0.095 does. Also, using harmonic mean means that F1-score will be 0, if either precision or recall is 0.
8. Conclusion
Congratulations! You have learned that the choice between precision, recall or F1-score to evaluate models depends on the relative impacts of FPs and FNs in your use-case. In particular, if both types of errors are undesirable, F1-score would be more suitable. In addition, you have gained a better intuition behind why F1-score is based on harmonic mean. Of course, there are other evaluation metrics in machine learning but I have deliberately kept this post focused mainly on F1-score. Alright then.. stay tuned for my next posts!
Hello! I’m Zeya. I like to break Data Science concepts down into simple, bite-sized chunks with clear and intuitive explanations. After all, that’s how I found myself learning most effectively. By sharing how I simplify concepts, I hope to help people lower their barriers of entry into learning Data Science. If you’ve found this post useful, do let me know in the comments. I welcome discussions, questions and constructive feedback too. Feel free to follow me on Medium or reach out to me via LinkedIn or Twitter. Have a great day!
References
- Bill Wilson (18 Nov 2021). Understanding the Harmonic Mean. http://groups.di.unipi.it/~bozzo/The%20Harmonic%20Mean.htm
Essential Things You Need to Know About the F1-Score was originally published in Towards Data Science on Medium, where people are continuing the conversation by highlighting and responding to this story.
from Towards Data Science - Medium https://ift.tt/3cIDTdi
via RiYo Analytics


No comments