https://ift.tt/3cRbEsT Make a smart choice for your EDA tasks Photo by Campaign Creators on Unsplash Exploratory Data Analysis (EDA) ...
Make a smart choice for your EDA tasks

Exploratory Data Analysis (EDA) is an integral part of any data science project. In simpler terms, it could be referred to as the “detective work” necessary to understand a dataset. These initial investigations lead to the discovery of non-obvious trends and anomalies, leading to enhanced understanding of the data at hand with the help of comprehensive visualizations and detailed statistics. Data scientists use EDA mainly to formalize various hypotheses for testing and next steps for data engineering to prepare datasets for their usage.
With EDA being the foundation of any data science project, data scientists need to make informed choices for EDA tools based on their requirements. Python offers a variety of EDA tools and libraries that augment the existing dataframes. While these tools share similar functionalities, each has unique aspects that make them stand out in different ways. We will review five of the most popular Python EDA tools: DataPrep, Pandas-profiling, SweetViz, Lux, and D-Tale. We will be focusing on the unique features and functionalities of each of these libraries to assist data scientists in picking the right tool for their EDA tasks.
Visualizations
Interpretable visualizations that effectively portray the hidden complexities of datasets are the most significant aspect of exploratory analysis. We will compare and contrast the types and quality of visualizations each tool supports.
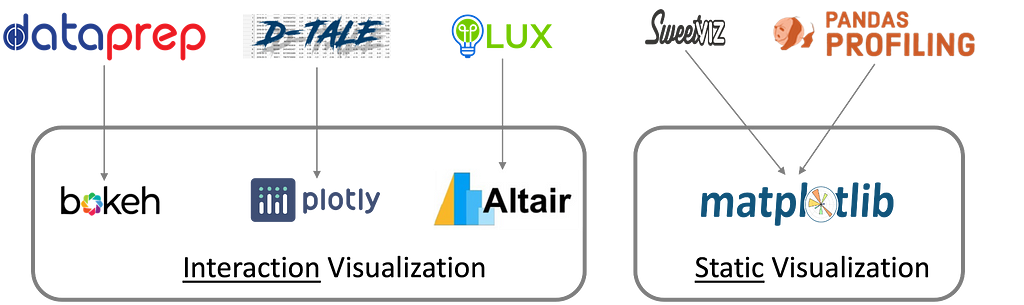
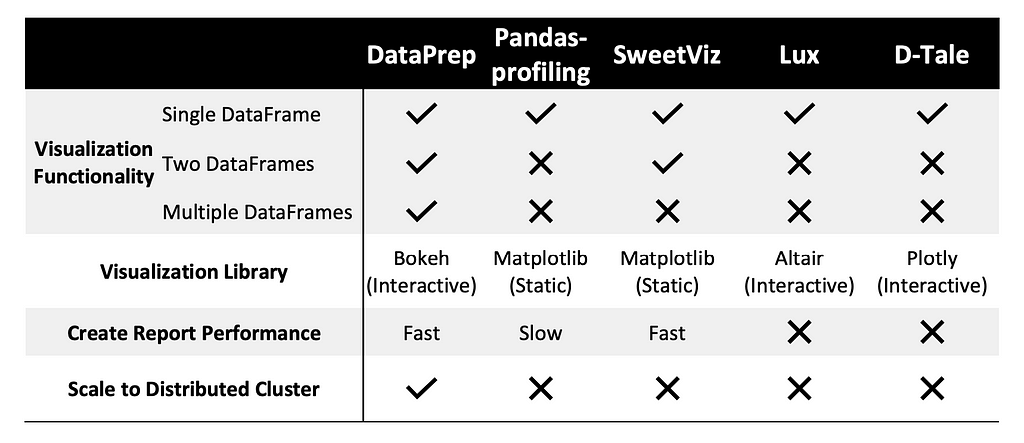
DataPrep offers a wide range of visualizations that the user can specify within the plot function of DataPrep. Some of the most notable visualizations include bar charts, histograms, pie charts, box plots, and geo plots to support the representation of various numerical, categorical, and geographical distributions. Visualizations in DataPrep use Bokeh, which makes them interactive. Another notable feature of DataPrep visualizations is insight notes displayed along with the visualizations. These insights provide a summary for the distribution and eliminate the need for the user to perform extra calculations. Furthermore, DataPrep allows users to easily format and customize the default visualizations to suit their design requirements.
from dataprep.eda import plot, plot_correlation, create_report, plot_missingcreate_report(df)

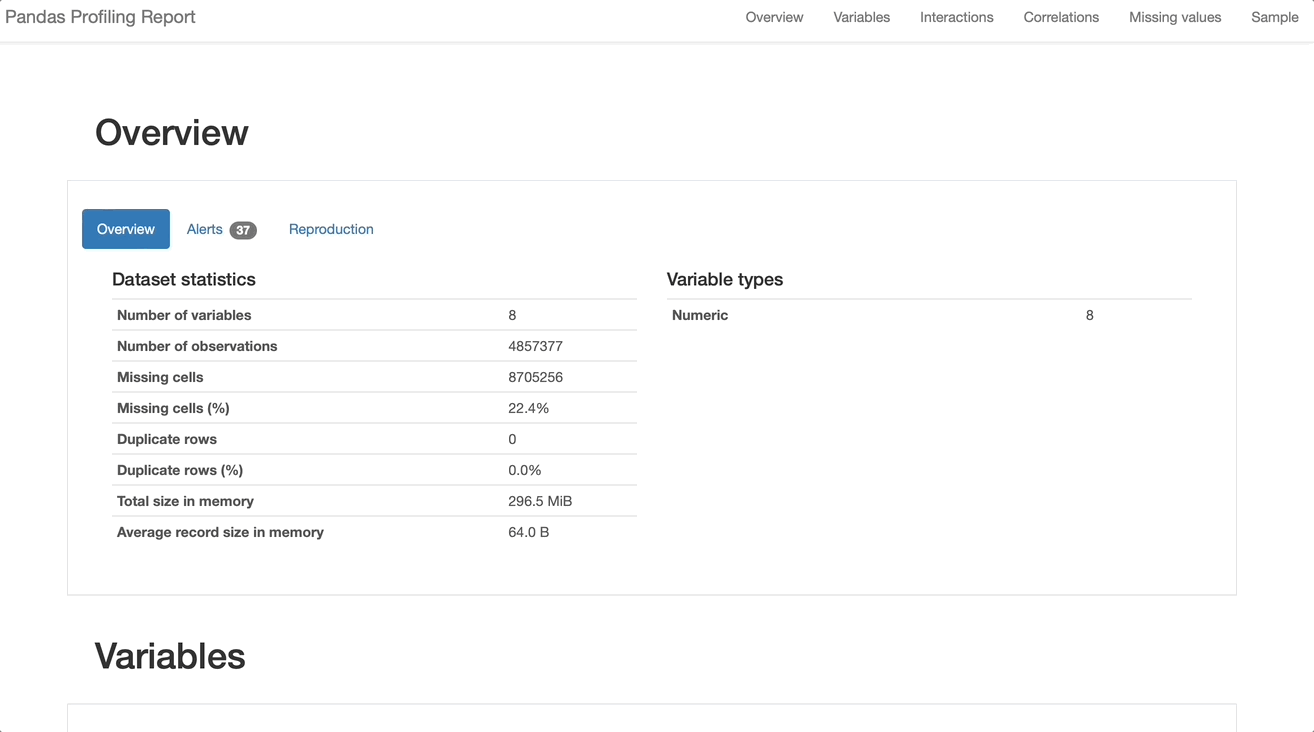
Pandas-profiling generates a clean report with visualizations such as histograms, pie charts, and bar charts. They provide a clear interpretation of each dataset attribute, but these matplotlib-based visualizations lack interactivity. Correlations between variables are displayed with heat maps only. The missing values component offers matrix, count, heatmaps, and dendrogram visualizations of missing values.
from pandas_profiling import ProfileReport
ProfileReport(df)
SweetViz generates an HTML report for one or two datasets with a detailed analysis of features. It supports similar visualizations to pandas-profiling, but the system is mainly known for visualizing target values and comparing datasets. SweetViz, unlike DataPrep, offers an only comparison between two dataframes. The results are color-coded onto the visualizations to create a clear contrast for the data scientist.
import sweetviz as sv
report = sv.analyze(df)
report.show_html()

Lux markets itself as an EDA library that both simplifies and speeds up data exploration. Lux is accessible to a wide range of audiences due to its simple syntax integrated with pandas. Lux offers a limited variety of visualizations. Data distributions are displayed using histograms, correlations between variables are modeled with scatter plots, and occurrences of categorical variables are presented using bar charts. A unique aspect of Lux visualizations is the Vis and VisList objects, which generate user-specified visualizations, including bar charts, histograms, scatterplots, and line graphs.
D-Tale provides a graphical interface to the users to interact with the dataframe. This design layout is intuitive to most beginners because of the similarity of the UI to Microsoft Excel. The interface has dropdown menus with options for selecting different visualizations with simple clicks. D-Tale supports a variety of visualizations such as line graphs, bar charts, pie charts, heatmap, word cloud, maps, and 3D scatterplots to summarize larger datasets. D-Tale offers similar visualizations for missing analysis to pandas-profiling: heat-maps, dendrograms, matrix, and bar charts. A unique type of visualization that makes D-Tale stand out is the network analyzer to visualize directed graphs.
Functionality
Understanding the unique capabilities of each EDA tool would help data scientists narrow down their choices smartly. Each of the tools we discussed above has distinguishing characteristics that might make each of them a better choice over the other based on task specification.
DataPrep uses Dask under the hood and offers faster data analysis by scaling on a distributed cluster. This improves the ability of the system to handle larger datasets through accelerated computations. Another feature of DataPrep that outshines is the comparison between multiple data frames. The plot_diff function can take a list argument with more than two data frames and plot the features side-by-side for easier comparisons.
DataPrep would be the ideal go-to tool for users analyzing and comparing more than two data frames. Overall, DataPrep is the most suitable choice when working with big data, thanks to its extended functionality with multiple data frames and Dask implementation for faster performance.
Pandas-profiling has also gained popularity based on its ability to handle large datasets. The library supports configuration to minimize the features generated for the EDA report to only highlight relevant attributes required by the user. Pandas-profiling also addresses the issue of data privacy through its sensitive feature, which only displays aggregate results of attributes from a confidential dataset.
Pandas-profiling is a good choice for EDA for smaller datasets where data privacy might be a concern. Pandas-profiling does not deliver a performance as high as libraries like DataPrep based on its pandas-based implementation. The report feature generates plots for all attributes in the dataset, which adds to the complexity of visualization parameters and customizability.
SweetViz offers users greater flexibility for displaying the EDA report. In addition to rendering the report as HTML in a web browser, it is also available in an IFRAME format compatible with Jupyter, Google Colab, and other notebooks. The latest version of SweetViz offers Comet.ml integration, which automatically logs reports generated to the user’s workspace via API.
SweetViz is an appropriate choice for users that are looking for visualizing target values and comparing two datasets. Unlike DataPrep, SweetViz supports comparison between a maximum of two dataframes.
Lux offers the ease of exporting static visualizations and integrating them into external notebooks. Users can either directly download their visualizations or export them as code. This makes the visualizations encoded as vis objects compatible with matplotlib, Altair, and vega-lite, where simple functions can output the corresponding code for each of these libraries.
D-Tale stands out based on its interactive GUI, which makes data formatting easier than other libraries. Users also have the option similar to Lux to export code snippets for corresponding visualizations, which allows greater flexibility to modify visualizations.
D-Tale is an ideal choice for generating interactive visualizations, thanks to the use of the plotly library. This gives D-Tale an edge over libraries that present findings with static visualizations.
Conclusion
For a task as crucial as EDA, using the right tool might not occur to every user. While all libraries share many features, the unapparent differences in these features distinguish the winner. Based on our detailed exploration of library features and experimentation with data, DataPrep stood out in terms of performance and visualizations.
Unlike SweetViz and pandas-profiling, the EDA report generated by DaraPrep has interactive visualizations, which provide users with more insights about the dataset they are analyzing. Not to forget, the Dask-based implementation of DataPrep gave it a significant edge with the shortest report generation time. DataPrep.EDA can be 10X faster than Pandas-based profiling tools due to its highly optimized Dask-based computing module [1]. On the other hand, pandas-profiling and Lux might be the choice of users who would like to stay in the comfort zone of pandas syntax. Both of these libraries offer additional functionality with a simple call about an existing dataframe. To further take up the level of convenience, D-Tale eliminates the coding required to perform EDA tasks with its interactive GUI. Every user might value a different characteristic of EDA tools, but, luckily, one of these five Python libraries would be sufficient to offer what a user is looking for.
References
[1] Jinglin Peng, Weiyuan Wu, Brandon Lockhart, Song Bian, Jing Nathan Yan, Linghao Xu, Zhixuan Chi, Jeffrey M. Rzeszotarski, Jiannan Wang: DataPrep.EDA: Task-Centric Exploratory Data Analysis for Statistical Modeling in Python. SIGMOD Conference 2021: 2271–2280
[2] Andreshg. (2021, April 29). Automatic EDA libraries Comparisson. Kaggle. Retrieved October 28, 2021, from https://www.kaggle.com/andreshg/automatic-eda-libraries-comparisson
[3] T., B. (2021, October 19). 7 cool python packages Kagglers are using without telling you. Medium. Retrieved October 28, 2021, from https://towardsdatascience.com/7-cool-python-packages-kagglers-are-using-without-telling-you-e83298781cf4
[4] Lockhart, B. (2020, July 5). Exploratory Data Analysis: Dataprep.eda VS pandas-profiling. Medium. Retrieved October 28, 2021, from https://towardsdatascience.com/exploratory-data-analysis-dataprep-eda-vs-pandas-profiling-7137683fe47f
Comparing the Five Most Popular EDA Tools was originally published in Towards Data Science on Medium, where people are continuing the conversation by highlighting and responding to this story.
from Towards Data Science - Medium https://ift.tt/3lcIxow
via RiYo Analytics


No comments