https://ift.tt/3G3K0WZ How to represent free-text with a graph, making its structure explicit and easily manageable by downstream algorithm...
How to represent free-text with a graph, making its structure explicit and easily manageable by downstream algorithms.
Text is a type of data that, when explored correctly, can be a source of valuable information. However, it can be challenging to explore data in textual form, especially free-text.
Free-text lacks explicit structure and standardisation. In this post I will show you how to represent free-text with a graph, making its structure explicit and easily manageable by downstream algorithms. There are various Natural Language Processing (NLP) tasks that can benefit from graph representations of free-text, such as Keyword Extraction and Summarisation. This is so because the implicit structure of text is now explicit in the form of a graph, which can be explored with standard graph-based algorithms, such as Centrality, Shortest Paths, Connected Parts, and many others.
In this post, I will present 3 different graph representations of a textual document. These are:
1) Undirected, unweighted graph;
2) Directed, unweighted graph;
3) Directed, weighted graph;
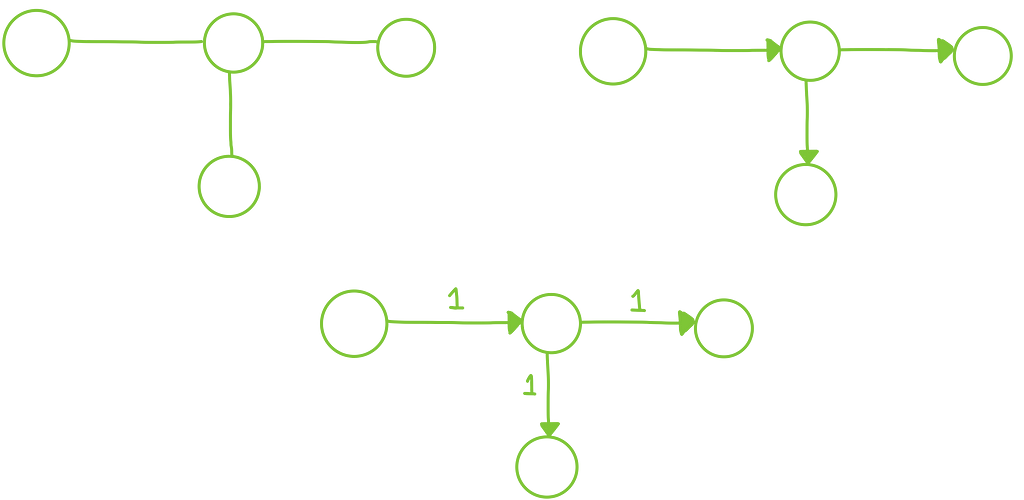
Whatever the representation is, the main idea is always the same: first, identify entities in the text to represent as nodes in the graph, and, second, identify relations between those entities to represent as edges between nodes in the graph. The exact types of entities and relations are context and task dependent.
Entities can be individual words, bigrams, n-grams, sequences of variable lengths, etc.; Relations can represent adjacency between entities in a sentence, co-occurrence in a window of fixed length, some kind of semantic or syntactic relation, etc.
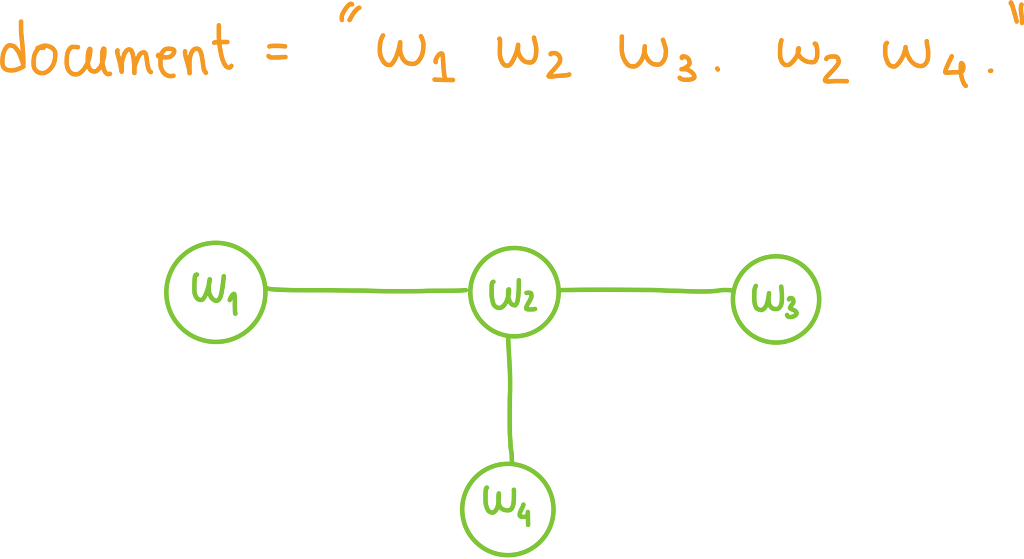
To keep it simple and approachable, I will consider individual words as nodes and them being adjacent (i.e., they form a bigram in a sentence) as a relation.
Even though I will present a Python implementation, based on NetworkX, all ideas and methods are easily transferable to any other implementation.
The following document will be our running example (adapted from Wikipedia):
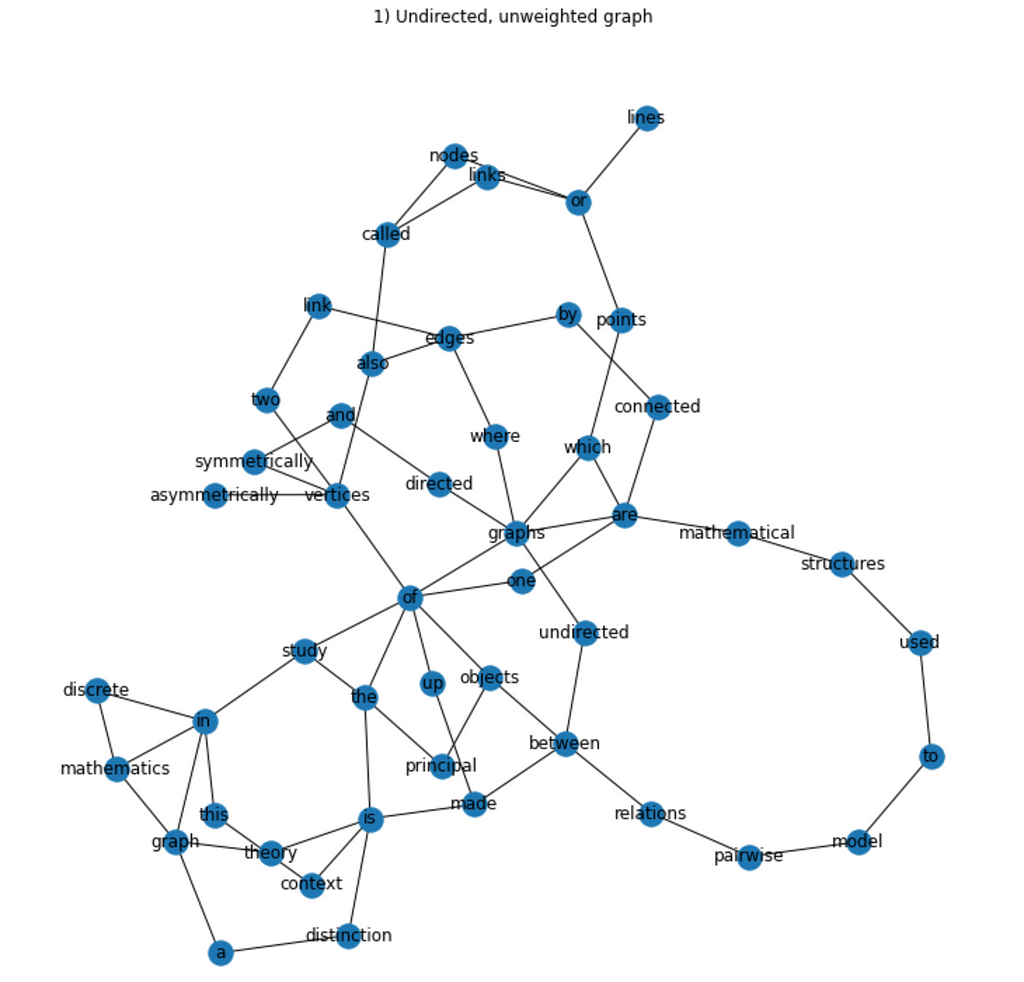
In mathematics, graph theory is the study of graphs, which are mathematical structures used to model pairwise relations between objects. A graph in this context is made up of vertices, also called nodes or points, which are connected by edges, also called links or lines. A distinction is made between undirected graphs, where edges link two vertices symmetrically, and directed graphs, where edges link two vertices asymmetrically. Graphs are one of the principal objects of study in discrete mathematics.
(1) Undirected, unweighted graph
As noted before, whatever the graph representation, the high-level method is always the same, in this case, composed of 4 steps:
- Document preprocessing;
- Identify entities (nodes in the graph);
- Identify relations (edges in the graph);
- Build the actual graph.
I will go over each of these steps now (and respective implementations). The implementation of each of these steps, especially the entity and relation getters, is what we have change to build the other graph representations.
Document pre-processing
According to the specifications above, individual words are nodes, and bigrams in sentences are edges. Thus, the preprocessing step must split the document in sentences and each sentence in words. Moreover, because we want to minimize variability, it must also lowercase all text (e.g., words “Hello” and “hello” are considered the same term). Because we are disregarding punctuation marks in our task definition, they are also removed.
Identify entities (nodes in the graph)
According to our definition, individual words are nodes in the graph. Thus, for each unique word in the document, there must be a node.
Identify relations (edges between nodes in the graph)
According to our definition, there exists an edge between two nodes in the graph if the corresponding words form a bigram in a sentence of the input document. Fortunately, in the pre-processing step, we split the document accordingly, which facilitates this calculation.
Building the graph
Now that we have the nodes and the edges, we can easily build the actual graph. In this example, I use NetworkX to build a graph object. We can now plot the actual graph with a simple function.
(2) Directed, unweighted graph
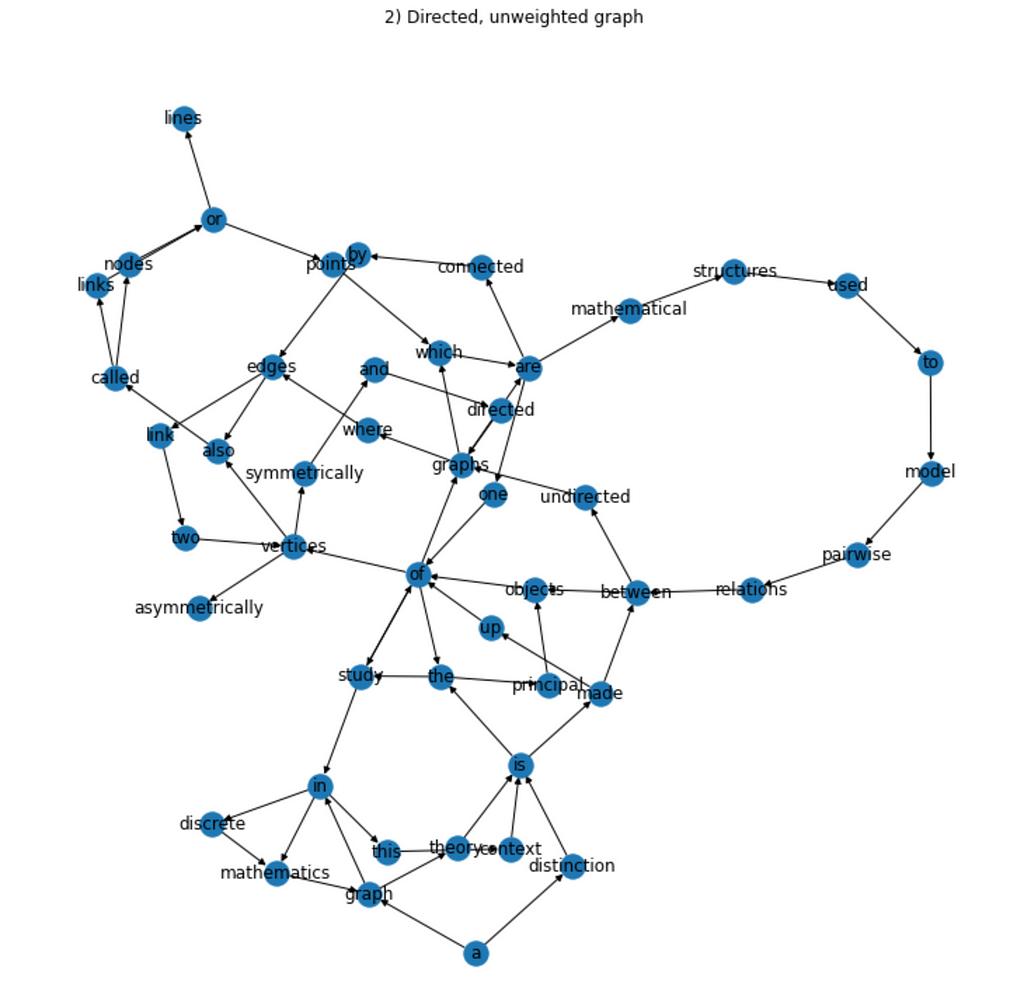
As noted before, in order to create a directed graph, we only have to change slightly the way we build the graph.
We will define the direction of the edge between two nodes as that of the order in which the corresponding words appear in a bigram. Thus, the bigram “a graph” will result in an edge from the node “a” to the node “graph”. Fortunately, the bigrams that we were capturing before already take into account the original word order in the text (i.e., we are never purposefully changing their order). This means that the only thing we need to change is the section where we build the actual graph object (in this case, with NetworkX), to tell it to take into consideration the direction of the edges.
Thus, we only need to change the line:
G = nx.Graph()
To (DiGraph stands for Directed Graph):
G = nx.DiGraph()
And we are done.
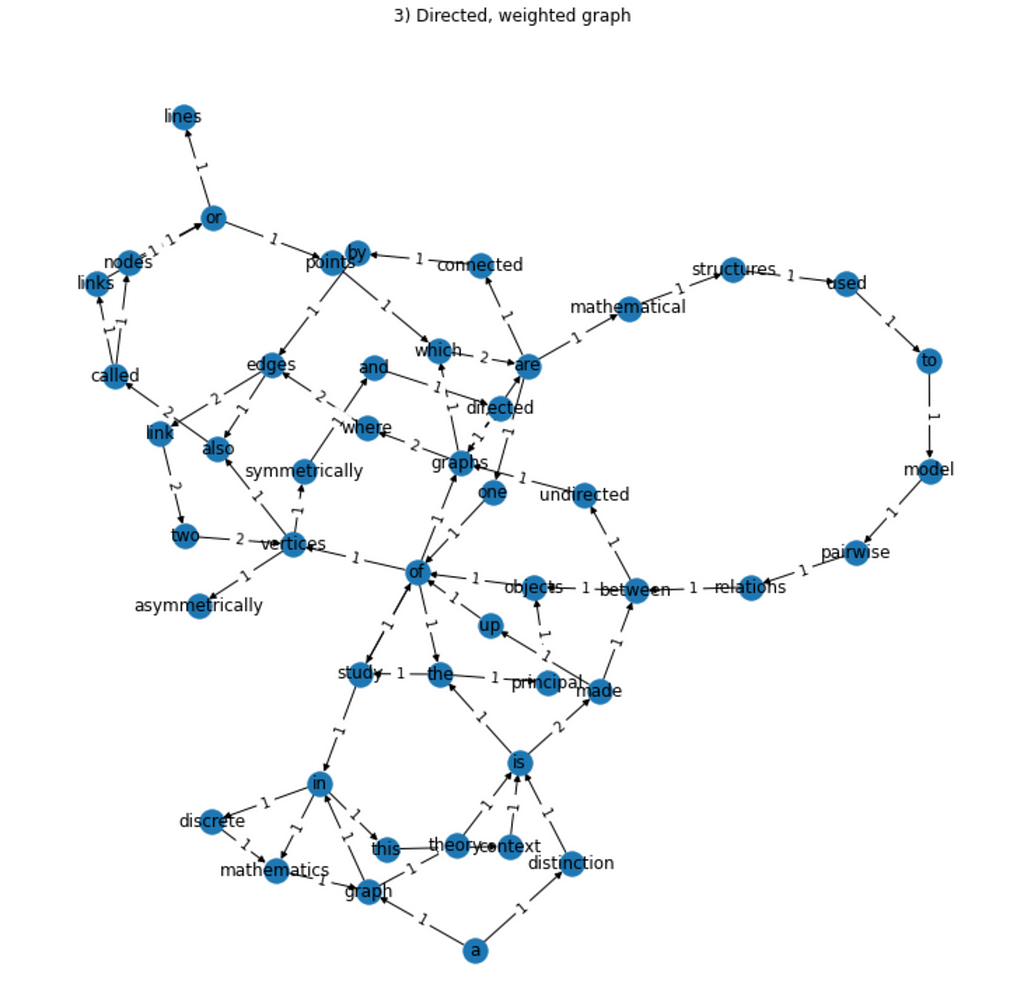
(3) Directed, weighted graph
Finally, the last piece corresponds to adding weights to the edges of the graph. In this case, we will weight each edge according to the number of the times the corresponding bigram appears in the document. Thus, if the bigram “a graph” appears 3 times in the document, the directed edge that links the nodes “a” and “graph” (in that direction) has weight equal to 3.
Thus, we need to change the relation getter defined before, to count the number of times each bigram is seen in the document.
And, finally, adapt the main function to account for the new weighted edge getter. Notice that the graph built is still a DiGraph, just like before, but the method to add weighted edges has a slightly different interface (different name).
Alright, now that I have a graph … what can I do with it?
Converting free-text to a graph representation makes the text’s implicit structure explicit. This means that now you have immediate access to information such as which words are most commonly used (degree), which n-grams are most commonly used, which words are most commonly used to flow information (paths in the graph between every two nodes), and much more. NetworkX provides a large amount of methods to apply to your graphs and extract valuable information.
I will make future posts on information extraction from text, some of which will be largely based on the graph representations we saw in this post.
Structuring Text with Graph Representations was originally published in Towards Data Science on Medium, where people are continuing the conversation by highlighting and responding to this story.
from Towards Data Science - Medium https://ift.tt/2ZcLBJu
via RiYo Analytics

ليست هناك تعليقات