https://www.dataquest.io/wp-content/uploads/2025/02/Download-the-resource-files.png In this guide, I’ll walk you through analyzing mobile ...
In this guide, I’ll walk you through analyzing mobile app market data to recommend profitable development strategies. This guided project, Profitable App Profiles for the App Store and Google Play Markets, will help you develop hands-on skills in Python, data cleaning, and exploratory analysis.
We’ll assume the role of a data analyst working for an app development company. Our goal is to identify the most lucrative app categories. By analyzing mobile app market data from both the Google Play Store and the Apple App Store, we’ll determine which types of apps are more likely to attract users and generate revenue.
What You’ll Learn:
- How to clean and preprocess raw datasets
- How to analyze app category trends and user preferences
- How to use frequency tables to uncover data insights
- How to organize and share your work via GitHub
Before diving into this project, ensure you're comfortable with Python functions, Conditional logic, Loops, and Jupyter Notebook basics. If you are new to Python, these foundational skills are covered in Dataquest's Python Basics for Data Analysis course.
Now, let’s get started with setting up your workspace!
Step 1: Setting Up the Environment
If you're working on this project within the Dataquest platform, you can skip this step as everything is already set up for you. However, if you'd like to work locally, ensure you have the following all set up:
- Jupyter Notebook: Install Jupyter Notebook or JupyterLab to work with the provided
.ipynbfile. Alternatively, use Google Colab for a cloud-based option that requires no installation. - Markdown Basics: Learn the essentials of Markdown to add headings and bullet points for clear documentation within your notebook.
- GitHub Setup: Create a GitHub account to follow along with the demo on uploading files.
-
Download the Resource Files
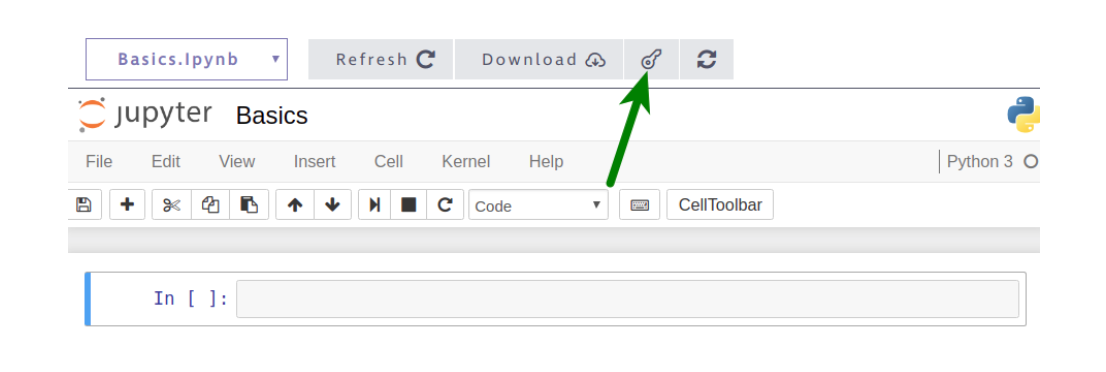
- Solution Notebook: The key icon at the top of our interface will also take you to the solution notebook.
- Google Play Store Dataset & Apple Store Dataset: You will find the dataset on page 2 of the project outline.
Step 2: Opening and Exploring the Data
We'll begin by loading and examining the datasets containing information about apps from both the App Store and Google Play Store. We're using this approach instead of pandas to ensure that beginners and those unfamiliar with pandas can still perform data analysis effectively. The tutor emphasized the importance of understanding what each dataset column represents before performing transformations or calculations.
from csv import reader

# Load the Google Play Store data
opened_file = open('googleplaystore.csv')
read_file = reader(opened_file)
android = list(read_file)
android_header = android[0]
android = android[1:]

# Load the App Store data
opened_file = open('AppleStore.csv')
read_file = reader(opened_file)
ios = list(read_file)
ios_header = ios[0]
ios = ios[1:]
To facilitate data exploration, we'll define a function that displays a specified number of rows from a dataset and shows the dataset's dimensions.
def explore_data(dataset, start, end, rows_and_columns=False):
    dataset_slice = dataset[start:end]
    for row in dataset_slice:
        print(row)
        print('\n')  # Adds a new line between rows

    if rows_and_columns:
        print('Number of rows:', len(dataset))
        print('Number of columns:', len(dataset[0]))

# Explore the first few rows of the Android dataset
print(android_header)
explore_data(android, 0, 3, True)

# Explore the first few rows of the iOS dataset
print(ios_header)
explore_data(ios, 0, 3, True)
Step 3: Data Cleaning
Data cleaning is a critical step to ensure the accuracy of our analysis. While cleaning is essential, removing too much data could lead to loss of valuable insights. Key considerations include:
- Removing Incorrect Data: Identify and remove rows with errors or missing information.
del android[10472] # Removing incorrect row with missing data
- Removing Duplicates: Some apps appear multiple times in the dataset. For the duplicate cases, we'll only keep the entries with the highest number of reviews. First we'll look for duplicate app names and create a list of unique apps and duplicate apps. Then, using a dictionary, we'll check if we have the highest review count for each duplicate app (because a higher review count most-likely corresponds with the most recent data point for that app). Finally, this deduplication process will create a new clean list called
android_clean.
duplicate_apps = []
unique_apps = []

for app in android:
    name = app[0]
    if name in unique_apps:
        duplicate_apps.append(name)
    else:
        unique_apps.append(name)

reviews_max = {}

for app in android:
    name = app[0]
    n_reviews = float(app[3])

    if name in reviews_max and reviews_max[name] < n_reviews:
        reviews_max[name] = n_reviews

    elif name not in reviews_max:
        reviews_max[name] = n_reviews

android_clean = []
already_added = []

for app in android:
    name = app[0]
    n_reviews = float(app[3])

    if (reviews_max[name] == n_reviews) and (name not in already_added):
        android_clean.append(app)
already_added.append(name)- Removing Non-English Apps: To maintain a relevant dataset, we filter out apps with names containing non-English characters. This is done by examining each character in the app name and checking its corresponding ASCII value. The English alphabet and common symbols fall within the standard ASCII range (0-127). However, to account for emojis or occasional non-English characters (such as accented letters), we allow up to 3 non-English characters before filtering an app out.
# Function to check if a string contains only English characters
def is_english(string):
    non_ascii = 0
    for character in string:
        if ord(character) > 127:
            non_ascii += 1
    if non_ascii > 3:
        return False
    else:
        return True

android_english = []
ios_english = []

for app in android_clean:
    name = app[0]
    if is_english(name):
        android_english.append(app)

for app in ios:
    name = app[1]
    if is_english(name):
        ios_english.append(app
Step 4: Isolating Free Apps
Since our company develops free apps, we'll focus our analysis on free applications.
# Filter out paid apps from both datasets
android_final = []
ios_final = []

for app in android_english:
    price = app[7]
    if price == '0':
        android_final.append(app)

for app in ios_english:
    price = app[4]
    if price == '0.0':
        ios_final.append(app)
Step 5: Analyzing App Categories
Understanding which genres are most common and popular can inform our app development strategy. We'll calculate the frequency of each genre and examine user engagement metrics.
# Function to generate frequency tables
def freq_table(dataset, index):
    table = {}
    total = 0
    for row in dataset:
        total += 1
        value = row[index]
        if value in table:
            table[value] += 1
        else:
            table[value] = 1
    table_percentages = {}
    for key in table:
        percentage = (table[key] / total) * 100
        table_percentages[key] = percentage
    return table_percentages

def display_table(dataset, index):
    table = freq_table(dataset, index)
    table_display = []
    for key in table:
        key_val_as_tuple = (table[key], key)
        table_display.append(key_val_as_tuple)

    table_sorted = sorted(table_display, reverse = True)
    for entry in table_sorted:
        print(entry[1], ':', entry[0])

# Display the frequency table for the prime_genre column in the iOS dataset
display_table(ios_final, -5)
Step 6: Determining Most Popular Apps by Genre
To identify which genres attract the most users, we'll calculate the average number of user ratings for each genre in the App Store dataset.
genres_ios = freq_table(ios_final, -5)

# Calculate the average number of user ratings per genre
for genre in ios_genres:
    total = 0
    len_genre = 0
    for app in ios_free:
        if app[-5] == genre:
            n_ratings = float(app[5])
            total += n_ratings
            len_genre += 1
    avg_n_ratings = total / len_genre
    print(genre, ':', avg_n_ratings)
Similarly, we'll analyze the Google Play Store dataset by examining the number of installs for each app category.
# Calculate the average number of installs per category

categories_android = freq_table(android_final, 1)

for category in categories_android:
    total = 0
    len_category = 0
    for app in android_final:
        category_app = app[1]
        if category_app == category:
            n_installs = app[5]
            n_installs = n_installs.replace(',', '')
            n_installs = n_installs.replace('+', '')
            total += float(n_installs)
            len_category += 1
    avg_n_installs = total / len_category
    print(category, ':', avg_n_installs)
Step 7: Uploading Your Project to GitHub
After completing your analysis, it's important to share and store your work. GitHub is a widely used platform for version control and project collaboration. If you're new to GitHub, you can start with GitHub Gist, which is a great way to share your work without diving into complex version control commands.
- Go to GitHub Gist.
- Log in to your GitHub account (or create one if you don’t have one).
- Click on "New Gist".
- Copy and paste your Jupyter Notebook code into the text box to upload your
.ipynbfile. - Add a description and select "Create secret Gist" (private) or "Create public Gist" (visible to everyone).
- Once uploaded, GitHub Gist will generate a shareable link that you can use to showcase your project.
For a more detailed tutorial on sharing your project with GitHub Gists, check out this guide.
Next Steps
Now that you’ve seen the full workflow, try this project yourself. Start working on the Profitable App Profiles Project now and put your skills to the test. Once you've completed your analysis, share your results and insights in our Dataquest Community to get feedback and engage with fellow learners.
If you’re new to Python or need a refresher, check out our Python Basics for Data Analysis course to build the foundational skills needed for this project.
from Dataquest https://ift.tt/npzP0vW
via RiYo Analytics


No comments