https://ift.tt/fZxsdip Hi there! I’m Anna Strahl, Senior Course Developer at Dataquest, and I know how challenging starting your first dat...
Hi there! I’m Anna Strahl, Senior Course Developer at Dataquest, and I know how challenging starting your first data project can feel. Questions like What dataset should I use? or Which tools are best? are totally normal. I’ve been there, and I’m here to help. In this guide, I'll walk you through two beginner-friendly projects—one in Python and one in SQL. Ready? Let’s dive in!
Why data projects are essential for learners
If you’re learning Python, SQL, or data visualization, projects are where the magic happens. I always say, projects should make up 70% of your learning time, with just 30% on new concepts. Here’s why:
- Apply what you know: Projects connect the dots between isolated skills. Think loops, functions, and file handling—all working together.
- Build confidence: Finishing a project proves your skills, which is great for job interviews.
- Create a portfolio: Projects show potential employers your problem-solving abilities in action.
When I was transitioning careers, working on data projects gave me concrete examples to discuss in job interviews, even before I had formal work experience.
Python project walkthrough: App store data analysis
Project overview
This project is all about analyzing app store data to spot trends for profitable apps. We’ll use Python and Jupyter Notebook—perfect tools for beginners.
Step 1: Get started with Jupyter Notebook
If you’re new to Jupyter Notebook, it might seem intimidating. Here’s what you need to know:
- Code vs. markdown cells: Code cells run Python, while markdown cells help you document your process.
- Execution order: Keep track of code cell numbers within brackets (i.e.
In [1]) to avoid running code out of sequence. - Restarting kernels: If things go wrong, restart the kernel and rerun your cells for a fresh start.
To make this process even easier, you can follow this step-by-step guide on installing Jupyter Notebook locally and creating your first project. If you are a beginner, we recommend you follow our split-screen interactive Learn and Install Jupyter Notebook project to learn the basics quickly.
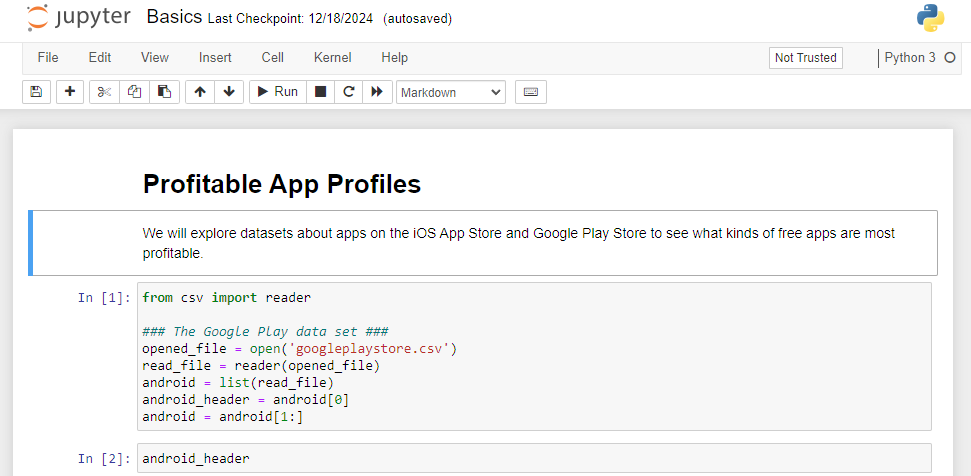
Step 2: Import and explore data
Let’s load our dataset using Python’s csv module:
from csv import reader

# Google Play dataset
opened_file = open('googleplaystore.csv')
read_file = reader(opened_file)
android = list(read_file)
android_header = android[0]
android = android[1:]
Pro Tip: Add code comments to document your workflow so your Future Self doesn’t forget what a particular line of code is doing.
Step 3: Troubleshoot common errors
Mistakes are part of the process—don't shy away from them! A common one is a file path error. If you see something like this in the code cell’s output:
FileNotFoundError: [Errno 2] No such file or directory: 'googleplay_store.csv'It means Python can’t find your file. Check the file name and directory. Don’t forget, you can always turn to the Dataquest community or our Chandra AI tutor for help.
Step 4: Prepare for deeper analysis
You now have a solid foundation with Jupyter Notebook—understanding how to organize your code, explore datasets, and troubleshoot common problems. At this point, you’re well-positioned to go deeper into data cleaning, analysis, and visualization.
From here, you can focus on data cleaning to ensure accuracy by removing duplicates or incorrect entries, move on to data exploration by calculating summary statistics to spot potential trends or patterns, and then visualize your findings with libraries like matplotlib or seaborn to create clear, compelling charts.
SQL project walkthrough: Exploring a relational database
Project overview
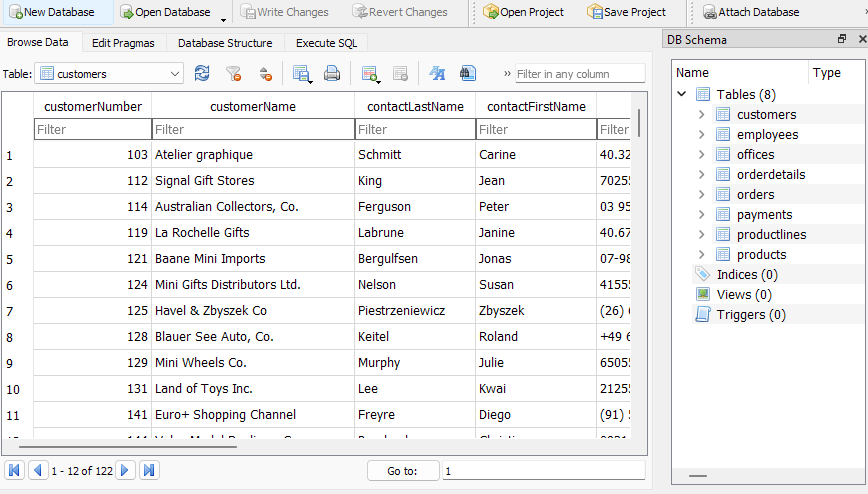
For SQL lovers, I’ll guide you through a project using SQLite to explore a database of customers, employees, and products.
Step 1: Set up SQLite
SQLite is lightweight and beginner-friendly. After installation, load your database and preview table schemas to understand the structure.
Step 2: Writing queries
Start simple by exploring the tables:
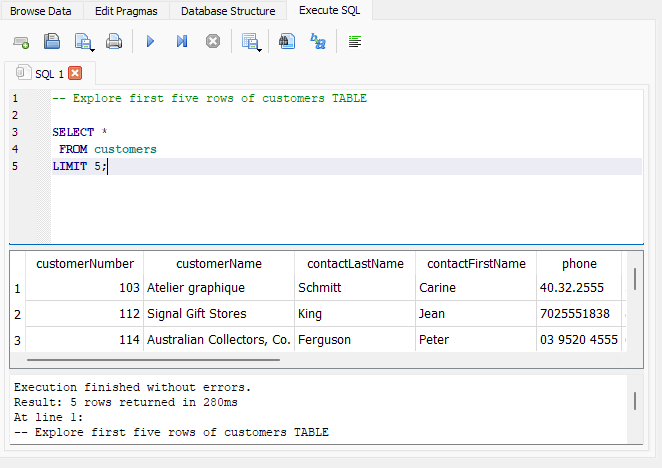
This query demonstrates:
- How to document query comments in SQLite using
-- - SELECT all (
*) columns - FROM the
customerstable - LIMIT the displayed output to the first 5 rows
Running simple queries like this can help get you used to the SQLite interface, especially if you are mostly familiar with running SQL queries within an online platform.
Step 3: Advanced querying and challenges
Let’s summarize all tables in one query using UNION ALL. It’s a powerful way to combine results across tables. Here we can see the query and output for the first two tables in the database (customers and employees):
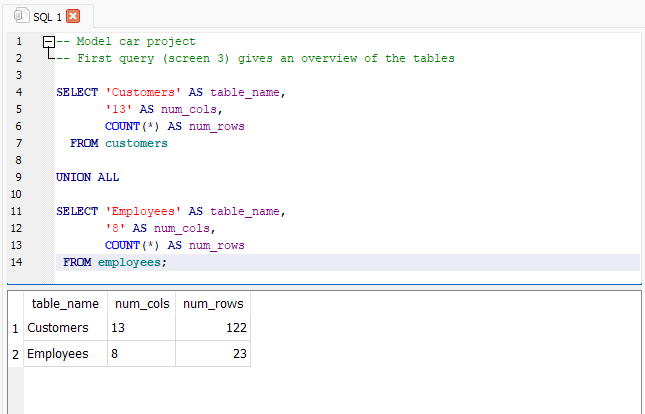
Notice that in order to combine information from multiple tables we used the UNION ALL operator and ensured our column names were consistent across multiple tables (table_name, num_cols,and num_rows)
Step 4: Prepare for deeper analysis
You now have a solid foundation with SQLite—understanding how to install it, explore table schemas, run basic queries, and even use operators like UNION ALL to combine data across tables. At this point, you’re well-prepared to tackle more complex analyses and database operations.
From here, you can build on your SQL skills by creating more sophisticated queries, like using joins or subqueries, optimizing performance with indexes, and even integrating your SQLite database into larger applications or visualization tools to derive deeper business insights.
Overcoming challenges: Troubleshooting and Debugging
- For Python: Use error messages as guides. Tools like Chandra AI tutor or online communities can clarify issues.
---------------------------------------------------------------------------
FileNotFoundError                         Traceback (most recent call last)
<ipython-input-1-2ed9ff83dc25> in <module>
      2
      3 ### The Google Play data set ###
----> 4 opened_file = open('googleplay_store.csv')
      5 read_file = reader(opened_file)
      6 android = list(read_file)

FileNotFoundError: [Errno 2] No such file or directory: 'googleplay_store.csv'- This error indicates the file doesn’t exist (note the arrow “——>” pointing to the line where the error occurred). This is a great hint that something about the file name isn’t working as expected.
- For SQL: Common errors, like mismatched column names or invalid syntax, can be resolved by referencing database schemas or testing smaller query components.
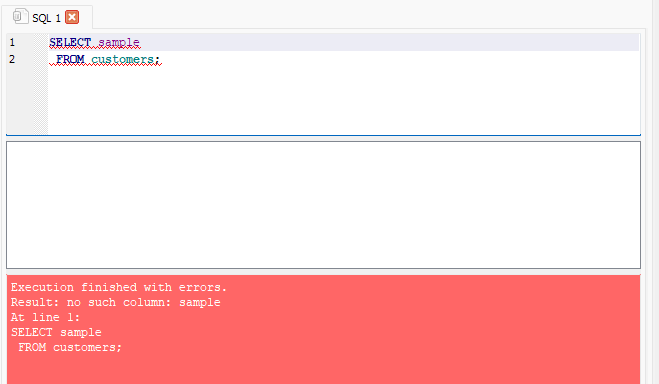
- This error indicates an error in
line 1, and specifies that the error occurs because the column listed doesn’t exist.
Publishing your first project
Once your project is complete, don’t let it gather dust. Share it! Publishing your work builds confidence and opens the door for feedback.
Recommended tools
-
GitHub Gist: Perfect for beginners. It allows you to share Python notebooks or SQL queries without worrying about complex repository structures.
-
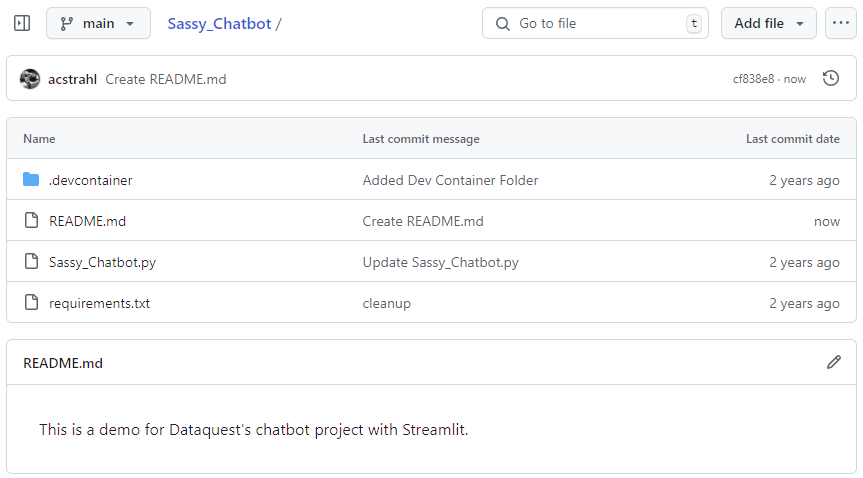
GitHub repositories: For more advanced users, repositories let you organize multi-file projects and collaborate with others.
Once published, others can leave comments or suggestions—a great way to refine your skills.
Iterating with feedback
Feedback is gold. Share your work in the Dataquest community, where learners and moderators can offer constructive advice. One learner improved their Star Wars project dramatically just by adding a table of contents and refining visualizations based on feedback.
Next steps: Build your first data project
Ready to start your own project? Here’s how:
- Choose a guided project: Start small with beginner-friendly projects available in Dataquest’s library.
- Practice on Dataquest or locally: Use tools like Jupyter Notebook, Jupyter Lab, Google Colab, or SQLite to build confidence.
- Document your process: Include markdown cells or SQL comments to explain your approach.
- Publish and share: Upload your project to GitHub or share it in the Dataquest community for feedback.
Building your first data project is a milestone. It boosts your skills, confidence, and career prospects. Remember, each project you complete builds your confidence and opens new doors for learning and growth. So, pick a guided data project today, and let’s get started!
from Dataquest https://ift.tt/0lW1VRq
via RiYo Analytics


No comments