https://ift.tt/z0cY4EQ Creating robust CO₂ scenarios for data-driven climate action Photo by David Aler on Unsplash / Sketch and montag...
Creating robust CO₂ scenarios for data-driven climate action

The effects of climate change are becoming increasingly visible around the world, from devastating wildfires to record-breaking heat waves and hurricanes. As a result, more and more people are looking for ways to reduce their carbon footprint and help mitigate the impact of climate change. However, it can be hard to know where to start or how to make a meaningful difference. We introduce a new way of modeling the carbon footprint of different activities using an open and linked data scheme. The related research article will be published in the journal Energy Reports later this year.
As the climate crisis continues to unfold with natural disasters occurring more frequently, the need to take action to reduce greenhouse gases (GHGs) has become increasingly urgent. One of the key challenges is understanding the impact of our daily activities on the environment. However, identifying the individual reduction potential can be complex and difficult to understand, as hidden, embedded emissions often occur somewhere else and are hard to visualize.
In recent years, you may have come across stunning illustrations for carbon footprints of daily activities such as receiving emails or streaming movies. Those comparisons are meant to give consumers a sense for something abstract like carbon emissions. They raise awareness and encourage people to take action to reduce their carbon footprint. However, in the interest of sound decision making, it’s important to validate the accuracy of these claims.

Fake news?
One such claim suggested that receiving a year’s worth of emails produced the same amount of carbon emissions as driving 200 miles in an average car. Unfortunately, this claim was not based on rigorous analysis and contained significant rounding errors. The author later dissociated himself from the claim.
Another popular claim suggested that watching just 30 minutes of Netflix was equivalent to driving almost 4 miles. However, this claim was also found to contain significant errors, including a conversion error and a failure to account for the carbon footprint of the end user device.
Obviously, reliable information is urgently required to assess and discuss carbon footprint scenarios, and the incidents above highlight the need for transparent and rigorous methodologies.
Context matters, a lot
But why is it so difficult to get reliable answers to seemingly basic everyday activities? Consider questions like the following: What is the distance I could drive my car to emit the same amount of carbon as taking a long-distance flight? Charging an electric car from the grid in France or Germany — what’s the difference? Choosing white meat over red one, what’s the benefit in terms of the carbon footprint? How does making a VoIP call (like via WhatsApp) compare to a regular mobile phone call?
The calculations underlying these scenarios are influenced not only by complex technical specifications but also by individual factors that may considerably differ based on the context of the scenario. For instance, when comparing with a flight, the fuel consumption of your car plays a significant role. The energy mix of the local grid is a crucial factor when charging an electric vehicle. For example, the carbon intensity of the French power sector was estimated at 58 grams of CO₂ per kilowatt-hour in 2021, and that of Germany at 349 grams.
Therefore, creating robust emissions scenarios that are tailored to the specific context is essential. They are fundamental for making robust comparisons and formulating clear and plausible recommendations.
The data model
In response to this challenge, we propose a universal data model for carbon footprint scenarios which improves accessibility and utility of carbon footprint data. It is designed to be open, linked, and modular, making it easy to share and reuse. The model is represented in JSON format and consists of several entities, each with a list of attributes and their data types. The entities include Scenario, Scope, Component, Link, Source, Emission, Consumer, and Consumption, each with their own unique attributes and relationships to other entities.
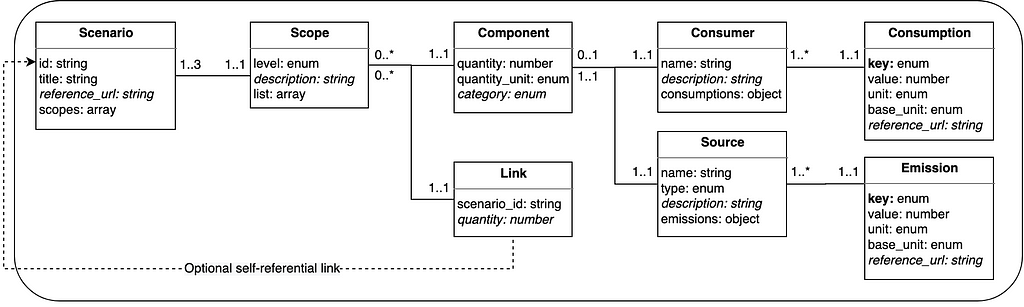
Any Scenario is identified by a Uniform Resource Identifier (URI). It features a title which optionally includes a reference in form of a hyperlink. A scenario covers 1–3 Scopes of emission as defined by the GHG Protocol. This entity may contain a description. Further, it includes 1 or several Components or Links. The latter simply relates to another scenario which is identified by its URI. It may be supplemented by an indication of quantity. A component, however, must include a quantity and a quantity unit (e.g., “km”, “kg”, “pcs”). It can also have a category which defines the type of consumer (e.g., “car”, “food”, “electronics”). Further, this entity must include a Source which has a name and a type (e.g., “France electricity grid” and “electricity”, or “premium gasoline” and “gasoline”). It can also include a description (e.g., “Year 2022”).
Any source must include 1 or more Emissions, implemented as key-value pairs. The type of emission defines the key (“co2e”, “co2”, “ch4”, “n2o”, “hfcs”, “pfcs”, “sf6”, “nf33”). Value, unit (e.g., “g”, “kg”, “t”) and base unit (e.g., “kWh”, “l”, “kg”, “km”) specify the emission details. A reference to the source of this information can be disclosed as hyperlink. The component may also have a Consumer when information about the energy efficiency is available (consider that emissions of food, for example, often are reported only per 1 kg produced). A consumer has a name (e.g., “Boeing 747”, “iPhone 14”), and optionally a description. It also includes 1 or more Consumptions (some consumers may support several energy sources, for example cars with combustion engine can be refueled with different types of gasoline; hybrid vehicles use gasoline and electricity) as key-value pairs. The type of energy defines the key (e.g., “electricity”, “gasoline”) and corresponds to the type of the source. Value, unit (e.g., “kWh”, “l”) and base unit (e.g., “km”, “h”, “d”) specify the consumption details. This information can be supplemented by a reference.
Here is a simple data sample:
{
  "title": "Mobility",
  "scopes": [
    {
      "level": "Scope 1",
      "list": [
        {
          "type": "component",
          "consumer": {
            "name": "Volkswagen Golf (2014)",
            "description": "Engine ID 45, 4 cylinders, Manual 6-spd",
            "consumptions": {
              "diesel": {
                "value": "0.0735046875",
                "unit": "l",
                "base_unit": "km",
                "reference_url": "https://www.fueleconomy.gov/"
              }
            }
          },
          "quantity": "10000",
          "quantity_unit": "km",
          "source": {
            "name": "Gas/Diesel oil",
            "type": "diesel",
            "emissions": {
              "co2e": {
                "value": "3.25",
                "unit": "kg",
                "base_unit": "l",
                "reference_url": "https://bilansges.ademe.fr/index.htm?new_liquides.htm"
              }
            }
          }
        }
      ]
    }
  ]
}
I need an interpreter
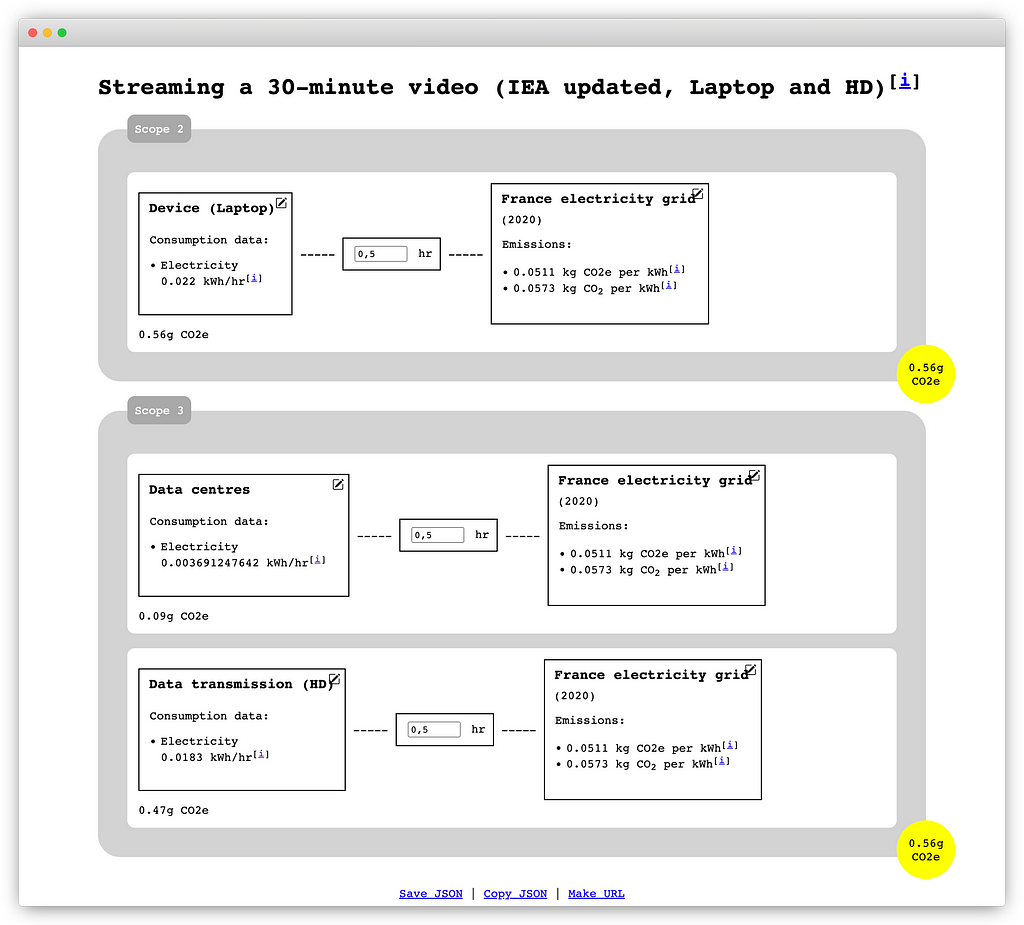
To bring the data to life, we developed a web-based viewer that can interpret and visualize this data format. The application aggregates the emission data by element and scope, performs unit conversion, and finds a common ground based on the availability of emission data by type of emission (e.g., “CO2e”, “CO2”). In the user interface, users can manipulate the data with immediate results, adjusting quantities for each element and connecting different data sources to replace consumer components and energy sources on-the-fly.
Customized scenarios can be downloaded as JSON files and shared via URL, making collaboration on scenarios easy. Finally, a benchmark view enables users to compare two or more scenarios by their identifiers.
The web application was built using Javascript and is deployed as a GitHub page, making it easy to deploy and update. The self-referential structure of our data model also allows for the hosting of nested scenarios in a distributed manner. The data interpreter is able to fetch and process these scenarios recursively, making it possible to access and analyze complex carbon footprint models in a distributed environment.
Detailed documentation on how to utilize and deploy the application can be found in our GitHub repository. Here, you can also access the source code, as well as a demo and several sample scenarios:
- Streaming a 30-minute video (IEA updated, UK)
- Streaming a 30-minute video (IEA updated, Laptop and HD)
- Singapore (SIN) to Paris (CDG) round-trip
- Sample personal carbon footprint (nested)
- Cargo ship emissions portfolio
Our approach aims to increase the transparency, accessibility, and explorability of carbon footprint scenarios, empowering individuals to make informed decisions regarding the environmental impact of their actions.
TL;TR
We propose a novel data model to generate carbon footprint scenarios which can be adapted to local or individual circumstances. Our viewer application showcases how users can enhance their comprehension of carbon emissions associated with diverse activities, and consequently make more informed choices. They can manipulate data in real-time and observe the impact of changing different components, such as using alternative energy sources or reducing the quantity of a particular material, on the overall carbon footprint. Additionally, the application facilitates a side-by-side comparison of different scenarios, allowing users to evaluate how they differ. Another essential feature of the application is its ability to enable easy sharing of scenarios, promoting collaboration and knowledge-sharing to reduce carbon emissions.
P.S.: Based on my assumptions, taking a long-haul flight from Paris to Singapore is equivalent to driving my car for 3,200 km.
B. Ruf and M. Detyniecki (2022), “Open and Linked Data Model for Carbon Footprint Scenarios”, 7th International Conference on Renewable Energy and Conservation (ICREC), Paris, France.
Carbon Footprint: Why Common Claims May Not Be Accurate was originally published in Towards Data Science on Medium, where people are continuing the conversation by highlighting and responding to this story.
from Towards Data Science - Medium
https://towardsdatascience.com/carbon-footprint-why-common-claims-may-not-be-accurate-6f7860a7f08b?source=rss----7f60cf5620c9---4
via RiYo Analytics


No comments