https://ift.tt/hNLxX5q The role of diversity in improving ensemble performance Photo by Mulyadi on Unsplash Ensemble learning is a ma...
The role of diversity in improving ensemble performance

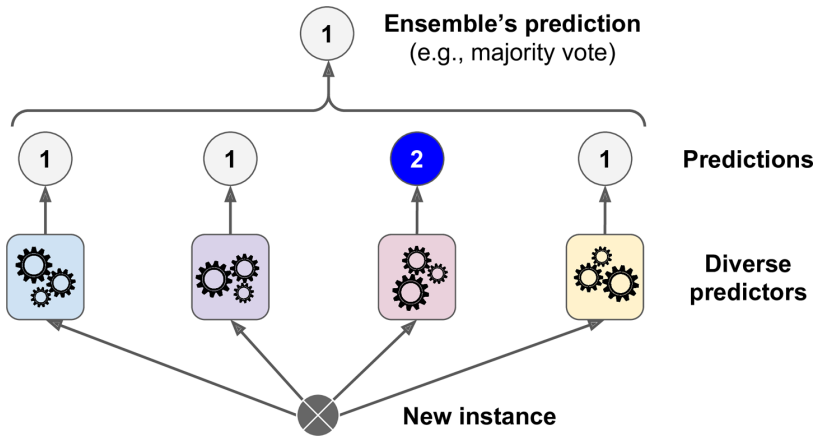
Ensemble learning is a machine learning technique that combines multiple models to achieve better results. It is only in recent years, with the increasing computing speed, that ensemble learning became one of the most effective techniques for tackling difficult problems in the machine learning domain. This approach is used in most of the winning solutions for machine learning competitions, with prizes up to 100,000 dollars.
How do we select the best ensemble members, to combine them in a single, more powerful model? In this article, we’ll explore how to choose models to ensemble and how to aggregate them.
What is diversity?
Ensemble learning is based on the concept of combining multiple models, called weak learners. The name comes from the idea that individual ensemble members don’t need to be very accurate. As long as they are a little bit better than a random model, combining them is beneficial. Diversity is an important concept in ensemble learning, and refers to the idea that the individual models prediction in an ensemble should be as different from each other as possible. This is because different models are likely to make different types of errors. By combining the predictions of a diverse set of models, we can reduce the overall error of the ensemble.
How can we increase diversity?
Over the years, several ensemble learning algorithms were developed. Each one has a unique way to achieve diversity. These approaches include:
Training each model on a different subset of the training data. When samples are drown with replacement, it’s known as bagging. When sampling is performed without replacement, it’s called pasting. It can also help to reduce the variance of the ensemble’s predictions, which can improve its generalization. The idea of diversity in bagging has been further developed in Random Forest and Extremely Randomized Trees. The first that achieves diversity by choosing a random number of features available to the trees at each split, while the latter employs a random split in order to lower the correlation between trees in the ensemble.
Training each model using a different set of features. An ensemble can be trained using different combinations of the available features or different transformations of the original features. This can help to capture different aspects of the data, leading to improved performance.
Training each model using a different type of algorithm. This is the approach used in voting and stacking meta-models. By using different algorithms, the individual models in the ensemble can capture different patterns in the data and make different types of errors.
However, diverse predictions are not always better.
Good and Bad diversity
In a majority vote ensemble, the concept of wasted votes can be used to understand the diversity of the ensemble. If the ensemble is already correct, low disagreement among the classifiers indicates that several votes have been wasted, as the same correct decision would have been made regardless of the individual classifiers votes. This is known as good diversity, as it measures disagreement where the ensemble is already correct. More disagreement in this situation means fewer wasted votes. In contrast, bad diversity measures disagreement where the ensemble is incorrect. In this case, any disagreement represents a wasted vote, as the individual classifier did not contribute to the correct decision made by the ensemble. To maximize the efficiency of the ensemble, it is important to increase good diversity and decrease bad diversity, which can be achieved by reducing the number of wasted votes.
Another way to think about this is from the accuracy perspective. For example, suppose that the decision tree model tends to be very good at identifying dogs, but has trouble with cats. The logistic regression model, on the other hand, is better at identifying cats but has trouble with dogs. Each of these algorithms has its own strengths and weaknesses, and will make different types of errors on the data. By combining the predictions of these two models, we can create an ensemble that is more accurate overall than either individual model. This is an example of good diversity. We could add a third model, bad at both classifying cats and dogs. The third model would increase the ensemble’s diversity without bringing any benefits. This is considered bad diversity. [2]
How can we measure diversity?
Let’s call f₁, f₂, … fₙ the predictions of different models in an ensemble.
There are two types of diversity measures: pairwise and global. Pairwise metrics need to be computed for every pair of fᵢ, fⱼ. In the end, you’ll get a nxn matrix. Global ones are computed on the whole matrix of predictions, and they are represented by a single value. The following list is by no means exhaustive, you can find more measures in the paper by Kuncheva, in the references.
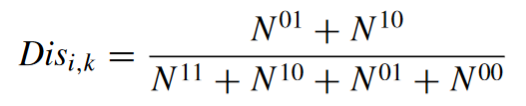
In the formulas, 0 means that the prediction is wrong, and 1 that is correct. For example, N⁰¹ means the number of times where the first classifier is correct, and the second is wrong.
Pearson correlation coefficient
The simplest way to compute similarity in an ensemble is to use Pearson correlation coefficient. If the predictions from two models are very correlated, it means that they are very similar. The maximum diversity is obtained when ρᵢⱼ = 0, while two classifiers that produce the exact same outputs will have ρᵢⱼ = 1. It’s possible to compute the correlation coefficient when the predictions are probabilities, like in soft voting ensembles.
The following metrics are used on binary class predictions.
Disagreement
As the name suggests, it’s how much disagreement there is between the predictions. It is calculated by dividing the number of times the predictions differ by the total number of predictions made. Disagreement takes values between 0 (there are no prediction that differ) and 1 (every prediction differs).
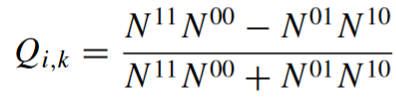
Yule’s Q
Yule’s Q has values between -1 and 1. This metric adds an important information: positive values indicate that models are classifying the same objects correctly, while those who are wrong on different objects will have negative Q values. The value of 0 suggests that the predictions are independent.
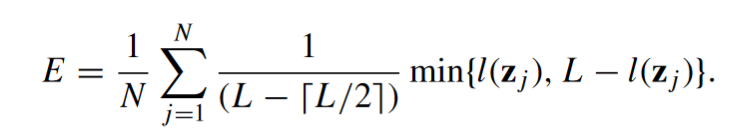
Entropy
The following measure is a global metric. It’s computed on the whole matrix of predictions. Entropy is based on the idea that when disagreement is the maximum, half of the predictions are zero, while the other half are one. In the following formula, L is the total number of ensemble members, and l is the total number of classifiers that correctly classify an instance zⱼ.
Python implementation
def coefficients(preds):
    A = np.asarray(preds[:, 0], dtype=bool)
    B = np.asarray(preds[:, 1], dtype=bool)

    a = np.sum(A * B)           # A right, B right
    b = np.sum(~A * B)          # A wrong, B right
    c = np.sum(A * ~B)          # A right, B wrong
    d = np.sum(~A * ~B)         # A wrong, B wrong

    return a, b, c, d

def disagreement(preds, i,j):
    L = preds.shape[1]
    a, b, c, d = coefficients(preds[:, [i, j]])
    return float(b + c) / (a + b + c + d)

def paired_q(preds, i, j):
    L = preds.shape[1]
    # div = np.zeros((L * (L - 1)) // 2)
    a, b, c, d = coefficients(preds[:, [i, j]])
    return float(a * d - b * c) / ((a * d + b * c) + 10e-24)

def entropy(preds):
    L = preds.shape[1]
    tmp = np.sum(preds, axis=1)
    tmp = np.minimum(tmp, L - tmp)
    ent = np.mean((1.0 / (L - np.ceil(0.5 * L))) * tmp)
    return ent
Building a voting classifier
Let’s now compare two ensembles to evaluate how diverse their members are. For the following examples I used pycaML, which allows to train and compare models and ensembles with few lines of code.
I choose 9 models for the first ensemble, and 10 models for the second one. Every models is trained with default parameters. The dataset is available in the UCI repository.
Model comparison
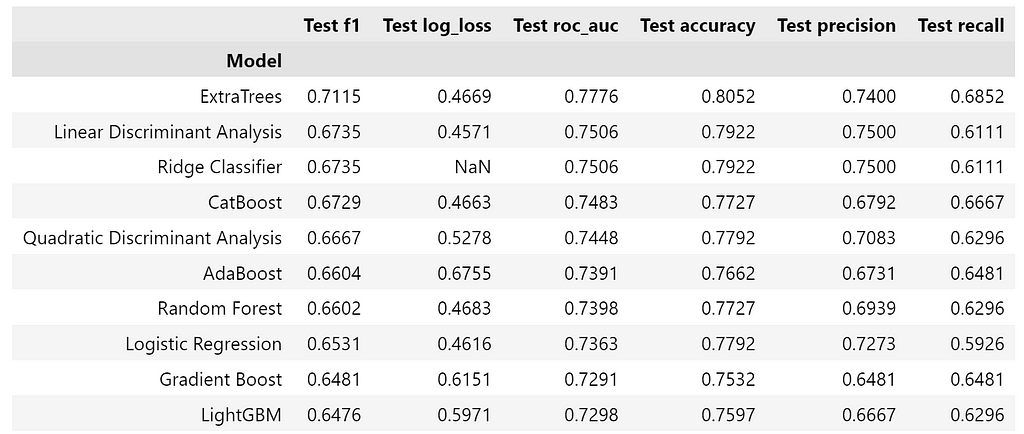
For having a baseline to compare the ensemble with, the following figure shows the 10 best performing models. We’ll focus on the F1 score.
from pmlb import fetch_data
from pycaML import ClassificationExperiment
name = 'diabetes'
df = fetch_data(name, return_X_y=False)
df.head()
df.to_csv(f'{name}.csv', index=False)
from pycaML import ClassificationExperiment
exp = ClassificationExperiment(name = name)
exp.load_data(f'{name}.csv', target='target')
exp.start()
exp.result.loc[:, exp.result.columns.str.contains('Test')].head(10)
The prediction matrix can be computed as follows. In the end, we’ll have a 154x19 matrix, where each row is an instance of the test set, and every column is a model. After obtaining the matrix, we can split it in two ensembles to compare them. The first one contains the odd indexed models, while the second one the even indexed models.
preds = pd.DataFrame()
for preds in exp.result.index:
    preds[preds] = exp.predict(preds)

preds.shape

# (154, 19)

ensemble_1 = preds.iloc[:, 1::2]
ensemble_2 = preds.iloc[:, ::2]

def disagreement_matrix(preds):
    res = np.zeros((preds.shape[1], preds.shape[1]))
    for i in range(preds.shape[1]):
        for j in range(i, preds.shape[1]):
            res[i, j] = disagreement(preds, i, j)
            res[j, i] = res[i, j]
    return res

sns.heatmap(d, annot=True, cmap='coolwarm', vmin=0, vmax=1, cbar = False)
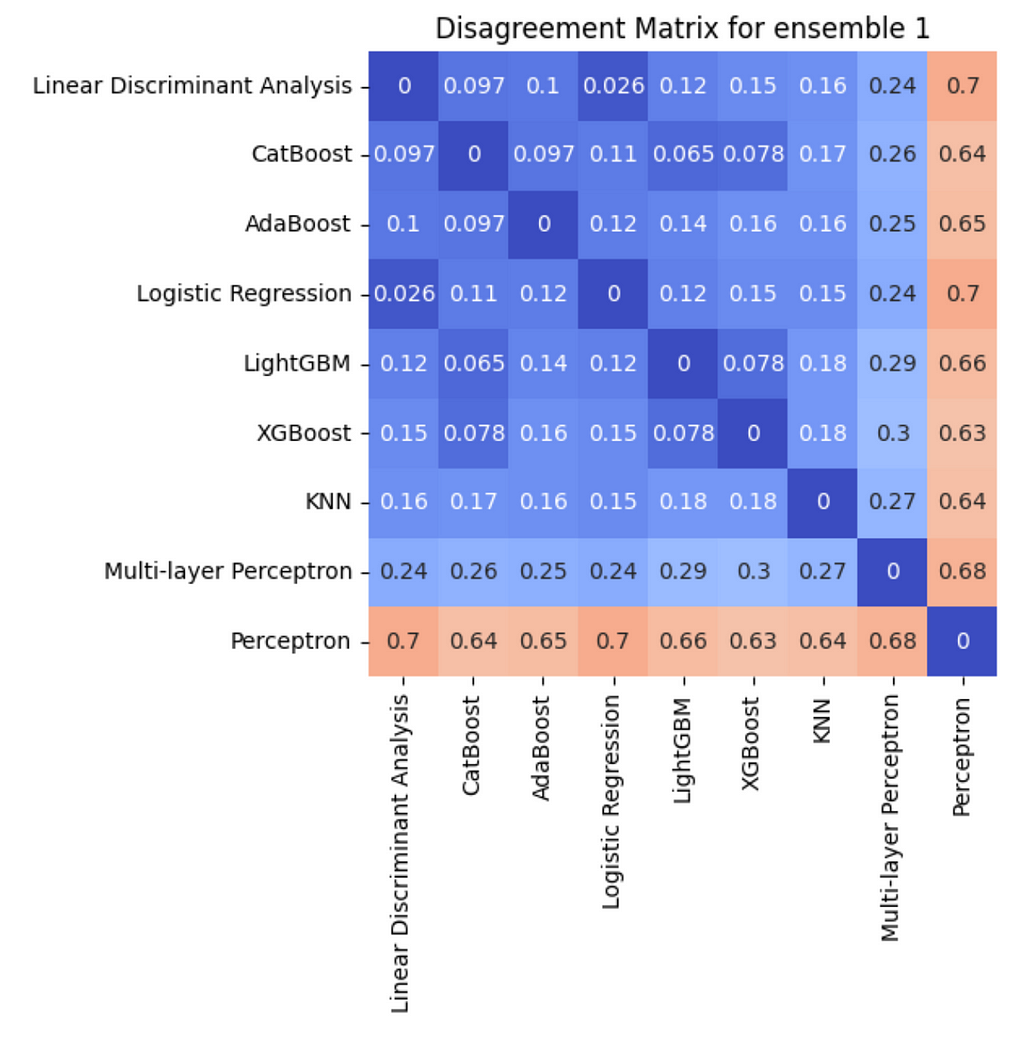
Looking at the disagreement matrix for ensemble 1, it seems that Perceptron is the model that disagrees the most with the others. On the other hand, there is little disagreement between boosting models.
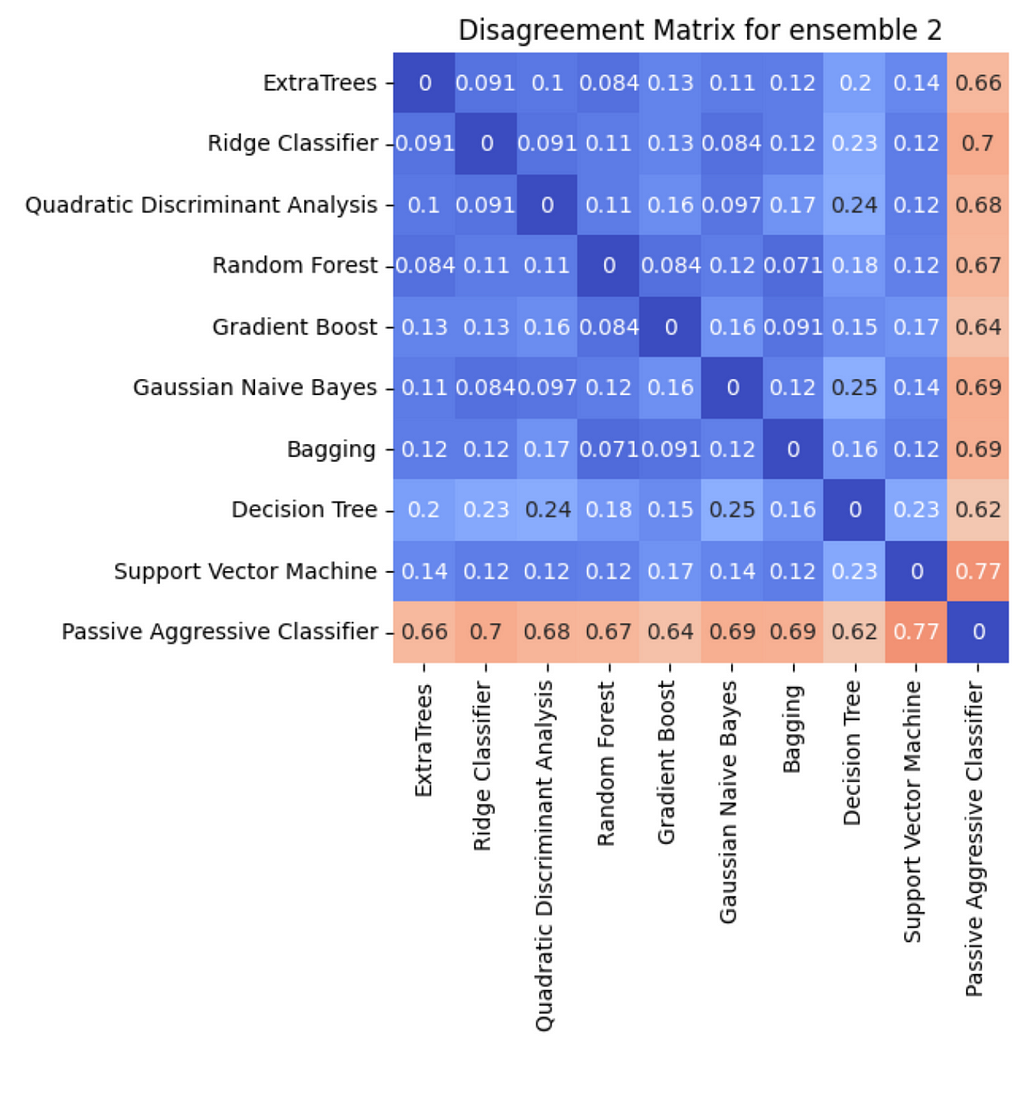
Ensemble 2 contains different models. Overall, it seems that disagreement is pretty low. The member with the highest disagreement is Passive Aggressive Classifier.
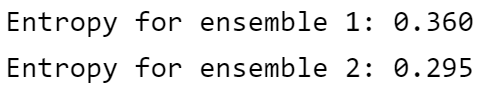
Since Ensemble 1 has higher entropy, it means that the diversity is higher.
Let’s now build the final model by taking the majority vote (mode). This meta-model is called hard voting. The two ensembles are evaluated using the same metric as before, F1 score.
preds_voting = preds.mode(axis=1)[0]
print(f'F1 score for {model}: {f1_score(preds_voting, y_test, average="macro"):.3f})
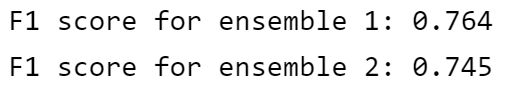
Finally, we show that higher diversity (ensemble 1) leads to a better ensemble model. The best model found in the comparison is Extra Trees, with a F1 score of 0.71. The final model performs better than the best model trained on the dataset by a considerable margin, reaching a score of 0.764.
Conclusions
Ensemble learning is a powerful machine learning technique that involves training multiple models and combining their predictions to achieve improved performance. We found that as the diversity of the models in the ensemble increased, the performance of the ensemble also increased.
This finding highlights the value of diversity in ensemble learning. When building an ensemble, it’s important to consider diversity among the models in order to achieve the best possible performance.
So, the next time you’re working on a machine learning project and considering using an ensemble, remember to prioritize diversity among the models. It could make all the difference in the final performance of your model.
References
[1] Géron, A. (2019). Hands-on machine learning with Scikit-Learn, Keras and TensorFlow: concepts, tools, and techniques to build intelligent systems (2nd ed.). O’Reilly.
[2] Kuncheva, L.I., Whitaker, C.J. Measures of Diversity in Classifier Ensembles and Their Relationship with the Ensemble Accuracy. Machine Learning 51, 181–207 (2003). https://doi.org/10.1023/A:1022859003006
Understanding the Importance of Diversity in Ensemble Learning was originally published in Towards Data Science on Medium, where people are continuing the conversation by highlighting and responding to this story.
from Towards Data Science - Medium
https://towardsdatascience.com/understanding-the-importance-of-diversity-in-ensemble-learning-34fb58fd2ed0?source=rss----7f60cf5620c9---4
via RiYo Analytics


No comments