https://ift.tt/tUlykOR Consume and Process Smartphone Sensor Data with FastAPI, Kafka, QuestDb, and Docker Devices are everywhere. Smartph...
Consume and Process Smartphone Sensor Data with FastAPI, Kafka, QuestDb, and Docker
Devices are everywhere. Smartphones, refrigerators, doorbells, watches, medical sensors, security systems, and fitness trackers, to name a few, are now commonplace and constantly recording (potentially high-frequency) information. These devices form a network known as the “Internet of Things”, or IoT, and provide rich data sources.
I recently became interested in how this data is ingested, processed, and stored. While resources on this topic are plentiful, few give examples with real-life data accessible to anyone. As I searched from article to article to learn about event-driven systems and streaming technologies like Apache Kafka, I came across a smartphone app, Sensor Logger, that allows users to stream data from motion-related sensors on their phones. Since I have a smartphone, this seemed like the perfect way to learn, and the “smartphone_sensor_stream” project was born. In this project, we utilize FastAPI, Kafka, QuestDB, and Docker to visualize real-time sensor data on a dashboard.
In this article, we will go over all of the main components of this project at a high level. Everything needed to run the project locally is available on GitHub, and a quick demo is available on YouTube. As a disclaimer, I am very much a beginner in event-driven systems and would greatly appreciate feedback to further my knowledge. Enjoy!
- GitHub - hfhoffman1144/smartphone_sensor_stream: Stream smartphone data with FastAPI, Kafka, QuestDB, and Docker.
- Streaming Smartphone Data with FastAPI, Kafka, QuestDB, and Docker
Project Architecture
Let’s start by looking at the architecture for this project (i.e. how data will flow from smartphones to a dashboard):
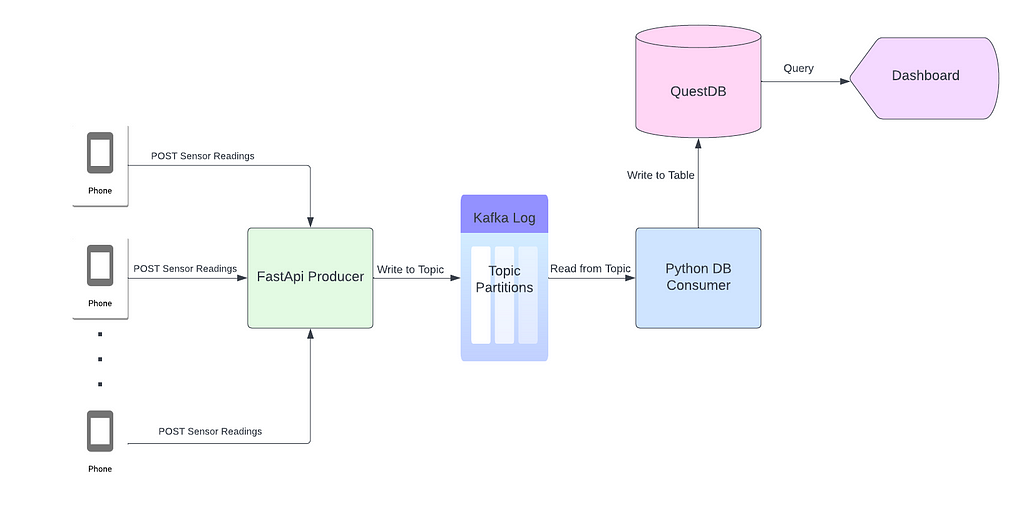
Each smartphone sends sensor readings (accelerometer, gyroscope, and magnetometer) via a POST request to a FastAPI application. FastAPI, the producer, asynchronously writes the sensor readings to a Kafka topic as JSON (the data from the request body). Each JSON object is ingested by a python process, the consumer, and stored in a QuestDB table. Once data is in the database, it is accessible by any downstream service or application that depends on it. For part 1 of this project, we will plot sensor readings on a dashboard using server-sent events (SSE).
Directory Structure and Docker Compose
This project is a collection of small services that interface with one another to get data from smartphones to the dashboard. Here’s the directory structure:
|-producer
 | |-app
 | | |-core
 | | | |-config.py
 | | |-__init__.py
 | | |-schemas
 | | | |-sensors.py
 | | |-main.py
 | |-requirements.txt
 | |-Dockerfile
 | |-entrypoint.sh
|-db_consumer
 | |-app
 | | |-core
 | | | |-config.py
 | | |-models
 | | | |-sensors.py
 | | |-db
 | | | |-ingress.py
 | | |-main.py
 | |-requirements.txt
 | |-Dockerfile
 | |-entrypoint.sh
|-ui_server
 | |-app
 | | |-core
 | | | |-config.py
 | | |-models
 | | | |-sensors.py
 | | |-static
 | | | |-js
 | | | | |-main.js
 | | |-db
 | | | |-data_api.py
 | | |-templates
 | | | |-index.html
 | | |-main.py
 | |-requirements.txt
 | |-Dockerfile
 | |-entrypoint.sh
|-README.md
|-.gitignore
|-.env
|-docker-compose.yml
We will write three services: the producer, consumer, and UI. Each service is packaged with a Dockerfile and orchestrated via docker-compose. Docker-compose allows us to run the services we write, with external services (Kafka, Zookeeper, and QuestDB), as individual containers connected through an internal network. Everything we need to orchestrate the services in this project is in a docker-compose file:
Notice the four services we don’t write ourselves (thankfully): Zookeeper, Kafka, QuestDB, and Kafka-UI. These services work together with the producer, consumer, and UI to create the project. We will walk through each service individually, but first, we need to understand the data source.
Sensor Logger
Sensor Logger is an iOS and Android app that allows users to log motion-related sensor readings from their smartphones. Users can view real-time sensor readings, export data as files, and push live data to a server via HTTP. This project leverages the HTTP functionality to extract sensor readings. To configure Sensor Logger, start by making sure all of the following sensors are selected:
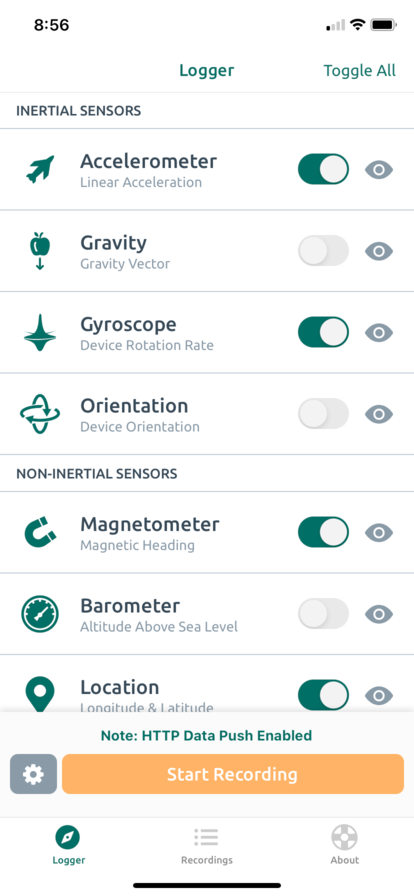
We will ingest readings from the phone’s accelerometer, gyroscope, and magnetometer. Next, we need to configure Sensor Logger’s settings so that it knows where to push data:
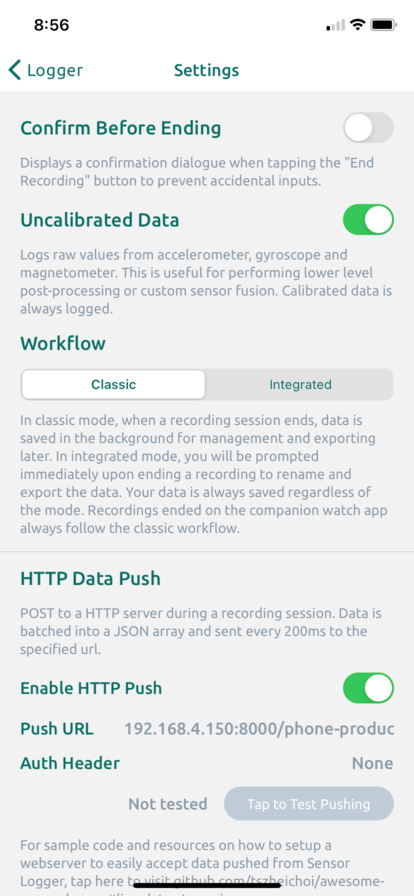
The most crucial component is to ensure the “Push URL” is correct — this is the endpoint of the FastAPI producer that accepts raw sensor readings via POST requests. We’ll use our computer as a server, so we need to identify the corresponding IP address. On a Mac, this is under System Preferences -> Network:
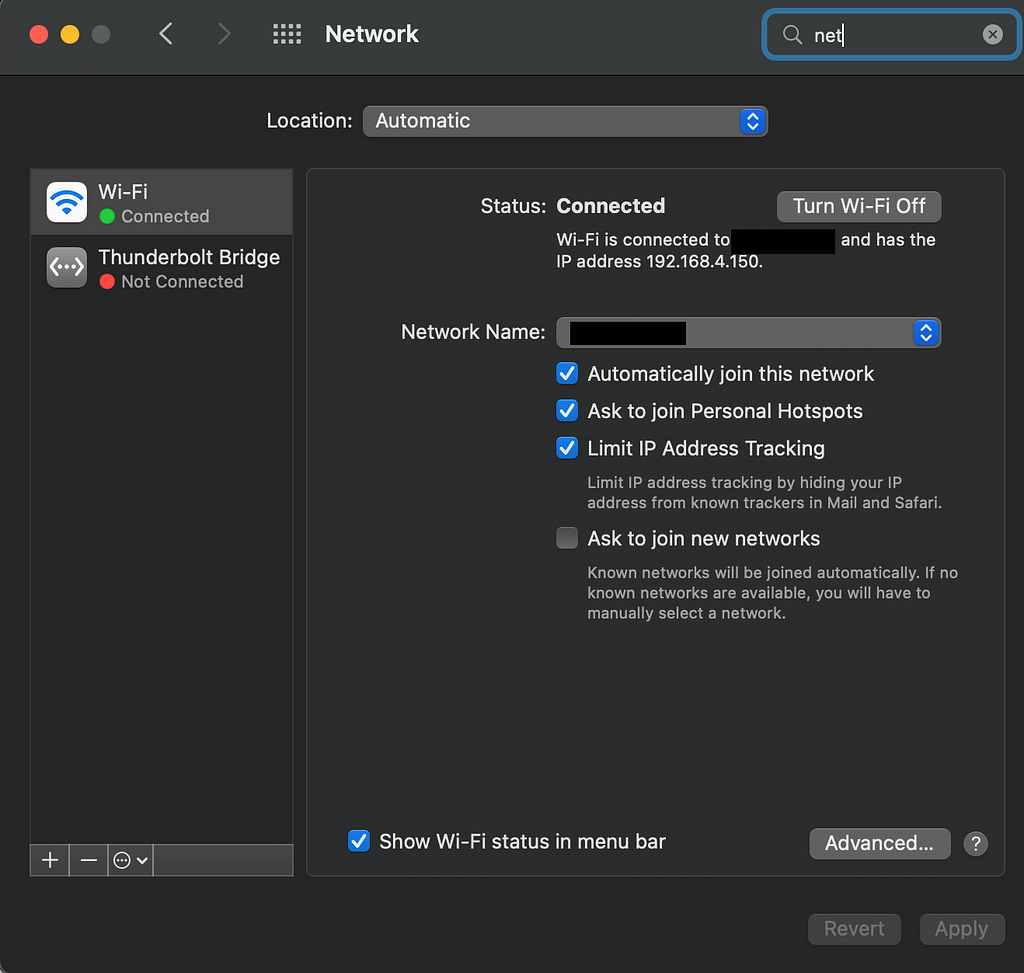
Note that the IP address of a computer is typically unique to a WI-FI network, meaning a new IP address is allocated every time a computer connects to a new network. Therefore, it’s crucial that the smartphone and the host computer are on the same network. The FastAPI producer accepts sensor readings at:
http://{your_ip_address}:8000/phone-producer
Paste the above URL into the “Push URL” box, and Sensor Logger should be ready to go!
Kafka and Zookeeper
This article won’t go into much detail about Kafka since there any many available resources on the platform. However, as a summary, Kafka is a highly performant framework for storing and reading streaming data. Kafka’s fundamental data structure is the log. Applications that write messages to the log are called producers. Unlike a queue, messages in the log persist even after being read — this allows multiple applications (known as consumers) to read simultaneously from different positions. For simplicity, this project only has one producer (the FastAPI application that writes raw sensor readings to Kafka) and one consumer (a python process that reads messages from Kafka and formats them in a database). Zookeeper is a service that helps manage the various components of Kafka.
Only two docker images are needed to get Kafka and Zookeeper running locally:
We’ll use the Bitmani distribution of Kafka and Zookeeper. The Kafka-UI image allows users to interact with Kafka clusters through a web application but is not required for this project. Save the above docker-compose file as docker-compose.yml, run docker-compose up, and a GUI similar to the following should be available at http://localhost:18080/ :
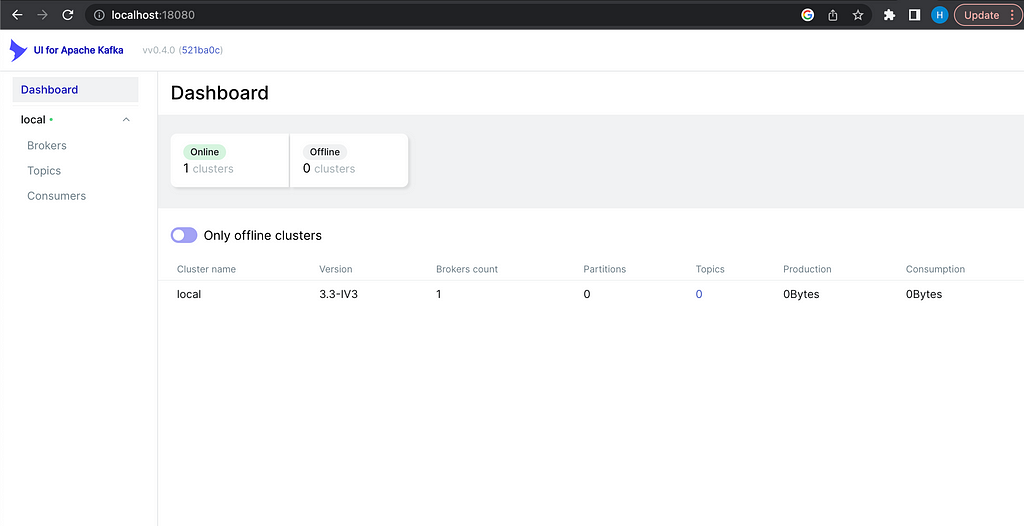
Information about brokers, topics, and consumers will be added to this dashboard as components are added to the system.
The Producer
So far, we have Sensor Logger configured to post raw sensor readings to a server and a Kafka instance ready to receive those readings. The next step is to create a bridge between the raw data and Kafka— the producer. The producer in this project is a FastAPI application that accepts data sent from smartphones and writes it to the Kafka log. Here’s the layout of the producer:
|-producer
 | |-app
 | | |-core
 | | | |-config.py
 | | |-__init__.py
 | | |-schemas
 | | | |-sensors.py
 | | |-main.py
 | |-requirements.txt
 | |-Dockerfile
 | |-entrypoint.sh
We won’t go through every file in the producer directory since everything is available on GitHub. Instead, let’s take a look at main.py (the driving script of the producer API):
Line 9 instantiates a FastAPI object. Lines 11–17 create an instance of a Kafka producer object with Aiokafka. Aiokafka allows us to write messages to Kafka asynchronously, meaning we don’t have to wait for Kafka to receive and process the message (in line 45) before we move onto the next line of code. Instead, Aiokafka sends the current message to Kafka and is almost instantly ready to produce another message. Lines 27–55 define the route that will receive raw sensor readings. To understand this better, let’s take a look at the request body format that this route expects (the data argument):
{"messageId": 20,
 "sessionId": "4bf3b3b9-a241-4aaa-b1d3-c05100df9976",
 "deviceId": "86a5b0e3-6e06-40e2-b226-5a72bd39b65b",
 "payload": [{"name": "accelerometeruncalibrated",
              "time": "1671406719721160400",
              "values": {"z": -0.9372100830078125,
                         "y": -0.3241424560546875,
                         "x": 0.0323486328125}},
             {"name": "magnetometeruncalibrated",
              "time": "1671406719726579500",
              "values": {"z": -5061.64599609375,
                         "y": 591.083251953125,
                         "x": 3500.541015625}},
             {"name": "gyroscopeuncalibrated",
              "time": "1671406719726173400",
              "values": {"z": -0.004710599314421415,
                         "y": -0.013125921599566936,
                         "x": 0.009486978873610497}},
...
]}
Each request body is a JSON object with entries “messageId”, “sessionId”, “deviceId”, and “payload”. Smartphones are uniquely identified by their “deviceId”. Every time a phone begins a new stream, a new “sessionId” is created for it. The “messageId” entry indicates the order a message falls in the sequence from the current session. The “payload” entry is an array of JSON objects that contain readings for each sensor configured in Sensor Logger. Every “payload” entry has the sensor’s name, the time the reading was recorded (in unix time), and the reading itself. We’re working exclusively with triaxial sensors, so every sensor should have “x”, “y”, and “z” readings corresponding with the three spatial dimensions.
The FastAPI route writes a raw request body directly to the Kafka topic (in line 45), and metadata is logged and returned in lines 47–55. This route is exposed at http://{your_ip_address}:8000/phone-producer, as discussed in the Sensor Logger section. All requests are validated by the Pydantic SensorReading object (i.e. any request that doesn’t match Sensor Logger’s format will not be processed by the route):
Configuration for the producer is handled through environment variables that are read in by a Pydantic BaseSettings object:
Environment variables are stored in a .env file:
# Kafka config
PROJECT_NAME=phone_stream_producer
TOPIC_NAME=raw-phone-stream
KAFKA_HOST=kafka
KAFKA_PORT=9092
and passed to the producer in the docker-compose file (line 9 below):
Notice the host argument in the start-up command is 0.0.0.0. This is what allows the producer to be accessed by its IP address from any device on the local network.
The Consumer
We now have the infrastructure to stream sensor data from smartphones to the FastAPI producer and Kafka. The next step is to create a process (the consumer) that reads from Kafka and does something with the data. Consumers can be responsible for anything related to reading and manipulating data stored in the log. The consumer for this project will be used to transform raw sensor readings and store them in a time series database known as QuestDB. Here’s the directory structure for the consumer:
|-db_consumer
 | |-app
 | | |-core
 | | | |-config.py
 | | |-models
 | | | |-sensors.py
 | | |-db
 | | | |-ingress.py
 | | |-main.py
 | |-requirements.txt
 | |-Dockerfile
 | |-entrypoint.sh
Before creating the consumer, we need to stand up a QuestDB instance. QuestDB is a highly performant open-source time series database with a Postgres-compatible API. This means we can query QuestDB tables as if they were row-oriented Postgres tables while reaping the benefits of column-oriented tables. We can run QuestDB using docker:
Notice in lines 5–8 that we are exposing ports 9000, 9009, and 9003. These ports, specifically port 9000, are used to write data to QuestDB tables. By including these ports in the expose section, and not in the ports section, we ensure that only containers running in the same Docker network can write data. Port 8812 is accessible outside the Docker network and is used to query data. The environment variables QDB_PG_USER and QDB_PG_PASSWORD , along with other QuestDB-related variables, are set in the .env file:
# Questdb config
DB_USER=admin
DB_PASSWORD=quest
DB_HOST=questdb
DB_PORT=8812
DB_IMP_PORT=9000
DB_NAME=qdb
DB_TRIAXIAL_OFFLOAD_TABLE_NAME=device_offload
The driving code of the consumer is in main.py :
There’s a lot to unpack here, but the core logic happens in lines 35–39. The consumer asynchronously loops through messages in the specified Kafka topic. This loop will continuously consume messages as long as the topic is updated. Messages are formatted and written to a QuestDB table using the following function:
The entire payload is formatted and saved as a CSV file in memory using StringIO. From there, the CSV is sent via a POST request to the QuestDB write port. This facilitates quickly writing an entire payload to QuestDB using a single connection and request.
The table that stores sensor data is designed to balance quick writes with quick reads. Here’s the query to create the table in QuestDB:
CREATE TABLE IF NOT EXISTS device_offload (
    device_id TEXT,
    session_id TEXT,
    device_timestamp TEXT,
    recorded_timestamp TEXT,
    sensor_name TEXT,
    x REAL,
    y REAL,
    z REAL
)
The device_id and session_id fields come directly from the first two entries of the raw payload, as discussed previously. device_timestamp is the time that an individual sample of sensor data was collected on the device, while recorded_timestamp is the time the sample hit the database. Because of this, we can measure how long it takes for a sample of data to get from the device to the database. Since we’re only working with triaxial sensors, we can store their values in the x, y , and z fields, and specify which sensor each sample belongs to in the sensor_name field. This schema enables us to write data from every sensor in a payload to the same table in a single write (as opposed to writing to multiple tables requiring multiple writes).
It’s important to note that, in a real-world setting, this QuestDB table would likely not be the final storage destination of the data. Instead, this table would act as a buffer, enabling applications to readily access data in a structured format. High frequency sensor data (50 hz in our case) quickly grows and becomes difficult to maintain. We would likely introduce another Kafka pipeline responsible for moving old data out of QuestDB and into an archive.
The last step for this consumer is to add the corresponding docker-compose commands:
The Dashboard
We have everything in place to visualize the sensor data as it’s written to QuestDB. To do this, we need to stand up another FastAPI application that polls the database and uses server-sent events (SSE) to update an HTML page. Here’s the last directory structure to examine:
|-ui_server
 | |-app
 | | |-core
 | | | |-config.py
 | | |-models
 | | | |-sensors.py
 | | |-static
 | | | |-js
 | | | | |-main.js
 | | |-db
 | | | |-data_api.py
 | | |-templates
 | | | |-index.html
 | | |-main.py
 | |-requirements.txt
 | |-Dockerfile
 | |-entrypoint.sh
As before, main.py is the driver for this app:
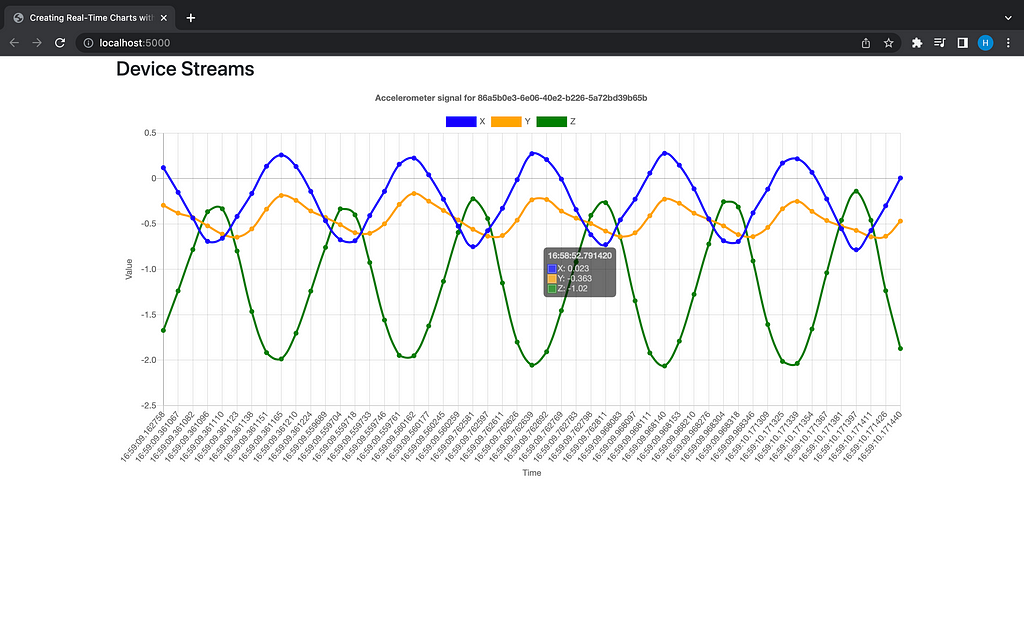
Every 0.1 seconds (line 90), the message_stream function will query the database for the most recent second of sensor readings (line 62). In this iteration of the dashboard, only accelerometer data is queried and displayed. The max_lookback_seconds argument is set to 60 — this means that any phones that haven’t sent data in the last 60 seconds will be filtered out in the query. Hence, this dashboard will display the most recent second of accelerometer data for all phones that have sent data at the last minute. Here’s the query logic:
Add the required lines to the docker-compose file:
And the dashboard should be available at http://localhost:5000:
Final Thoughts
This article gave a high-level overview of a real-time streaming project with a data source that most people have access to (smartphones). While there are a lot of moving parts here, we merely peeked into the world of data streaming. Perhaps in a future article we can improve upon this project and add more consumers. As always, feedback is greatly appreciated. Thanks for reading!
Like my articles? Buy me a coffee: https://www.buymeacoffee.com/HarrisonfhU
References
Apache Kafka: https://kafka.apache.org/
Event-Driven Architectires — The Quere vs The Log: https://jack-vanlightly.com/blog/2018/5/20/event-driven-architectures-the-queue-vs-the-log
Lucidchart: https://www.lucidchart.com/
Kafka Poc using FastApi: https://github.com/GavriloviciEduard/fastapi-kafka
geo-stream-kafka: https://github.com/iwpnd/geo-stream-kafka
18 Most Popular IoT Devices in 2022: https://www.softwaretestinghelp.com/iot-devices/#:~:text=Smart%20Mobiles%2C%20smart%20refrigerators%2C%20smartwatches,there%20by%20the%20year%202022%3F
FastAPI: https://fastapi.tiangolo.com/
QuestDB: https://questdb.io/docs/
Row vs Column Oriented Databases: https://dataschool.com/data-modeling-101/row-vs-column-oriented-databases/
A Real-Time Streaming Project with Smartphone Data was originally published in Towards Data Science on Medium, where people are continuing the conversation by highlighting and responding to this story.
from Towards Data Science - Medium
https://towardsdatascience.com/a-real-time-streaming-project-with-smartphone-data-7e838a1b009d?source=rss----7f60cf5620c9---4
via RiYo Analytics


ليست هناك تعليقات