https://ift.tt/8jl7JgI An open source library for exploratory data analysis In machine learning, we accept glue code as a necessary, but l...
An open source library for exploratory data analysis
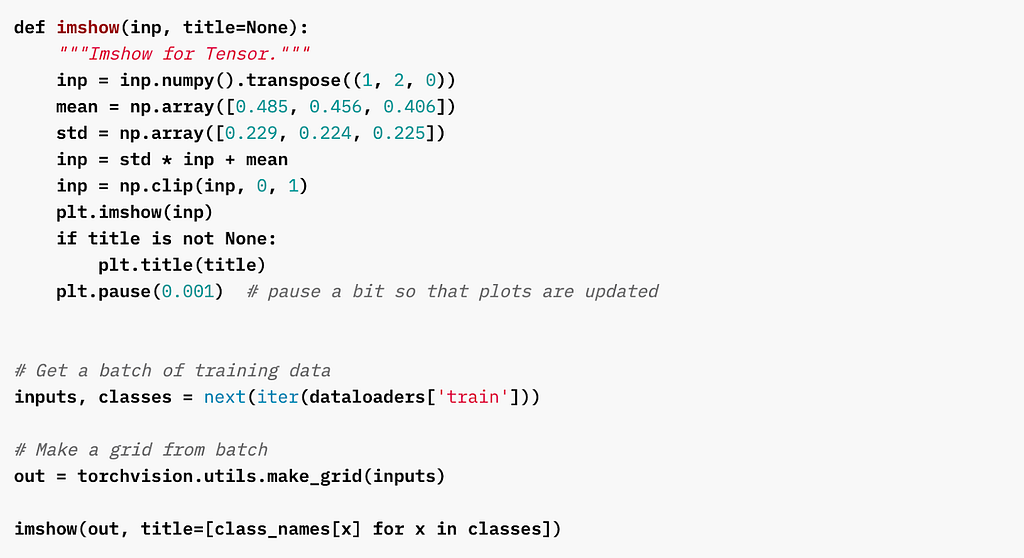
In machine learning, we accept glue code as a necessary, but largely benign evil. Even the most beginner-friendly computer vision tutorial will include some awkward, customly defined renderImage() method that you will need to simply display an image.
Every data science team I’ve worked with has had a collection of these “bespoke” utility scripts, particularly around more ad hoc processes like exploratory data analysis. For the most part, these little hacks work — until they don’t.
Inevitably, the same pattern occurs. The project matures from “see if this works” to “deploy this to production,” and the rising complexity leads to compounding difficulty:
- I have a dataset with 2.5 million images, and I’ve written a showImage() method. How do I run it on all 2.5 million images without crashing this notebook?
- I have a deployed object detection model, and I can see from my hacked-together dashboard that its overall performance is degraded. How can I visualize individual predictions as images with bounding boxes and labels?
- Our new dataset has an incredible number of features. We have a script for generating a statistical summary of the whole dataset, but how do I perform queries (grouping, sorting, filtering, etc.) against the data?
Suddenly, your utility functions become utility software. The backend team builds a service for rendering images with labels and transforms, but it’s temperamental and only works with particular formats. Someone on your team builds a “pipeline,” which is really just a well-meaning patchwork of Python scripts that make some pretty rigid assumptions about your data. And now, you spend hours writing utility functions for your utility software, and you think longingly of probability theory
After dealing with this issue for years, my colleague Doug Blank and I gave up on trying to find a perfect tool, and decided to build our own. Fast forward several months (and several major refactors), and we are finally ready to release our new open source library, Kangas, for its initial beta.
Introducing Kangas V1: Open Source EDA for Computer Vision
In these early days of Kangas (like “kangaroos” without the “roo,” for reasons we aren’t entirely sure of ourselves), we’ve set out to solve three specific problems in exploratory data analysis:
1. Large datasets are painful to process.
While pandas is a fantastic tool, it stores its DataFrames in memory, crippling performance as your dataset grows. Implementing a third party tool like Dask is a good option for building a complex pipeline ahead of production, but slows you down in research.
This is where we started with Kangas. We thought “What if instead of storing a DataFrame-like object in memory, we stored it in an actual database?” Which then transformed into “What if DataFrames actual databases?”
The base class of Kangas is the DataGrid, which you define using a familiar Python syntax:
from kangas import DataGrid
dg = DataGrid(name="Images", columns=["Image", "Score"])
dg.append([image_1, score_1])
dg.show()
Note: There are actually several different ways of constructing a DataGrid. For more, see here
A Kangas DataGrid is an actual SQLite database, giving it the ability to store vast amounts of data and perform complex queries quickly. It also allows DataGrids to be saved and distributed, even served remotely.
2. Visualizing data takes hours.
To explore a CV dataset, you need to see the images themselves, as well as the relevant metadata and transformations. You need to be able to compare images across views, chart aggregate statistics, and ideally, do it all inside a single UI. Your typical mishmash of libraries results in output best described as “functional,” not beautiful.
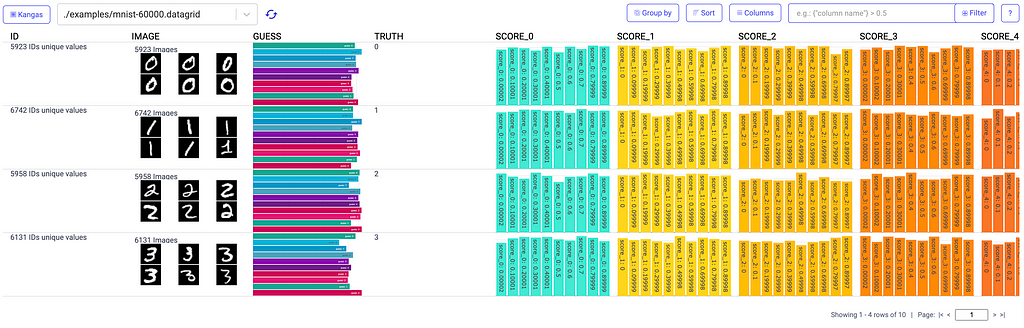
Visualizations in Kangas needed to be easy, fast, and slick. Instead of relying on a Python library, we built the Kangas UI as an actual web application. Server side rendering (using React Server Components), allows Kangas to render visualizations quickly while performing a variety of queries, including filtering, sorting, grouping, and reordering columns.
On top of this, Kangas provides built-in metadata parsing for things like labels, scores, and bounding boxes:
3. EDA solutions are rarely interoperable.
One of the challenges of EDA is that data is often messy and unpredictable. Your colleague’s “eccentric” preference in tooling often changes your data in the least intuitive way. In an ideal world, you wouldn’t need to change your workflow to contend with this variability—it would all just work. To achieve this in Kangas, we had to do several things.
First, we wanted to make sure that any type of data could be loaded into Kangas. To this end, Kangas is largely unopinionated about what you store inside a DataGrid. Kangas additionally provides several constructor methods for ingesting data from different sources, including pandas DataFrames, CSV files, and existing DataGrids.
import kangas as kg

# Load an existing DataGrid
dg = kg.read_datagrid("https://github.com/caleb-kaiser/kangas_examples/raw/master/coco-500.datagrid")

# Build a DataGrid from a CSV
dg = kg.read_csv("/path/to/your.csv")

# Build a DataGrid from a Pandas DataFrame
dg = kg.read_dataframe(your_dataframe)

# Construct a DataGrid manually
dg = kg.DataGrid(name="Example 1", columns=["Category", "Loss", "Fitness", "Timestamp"])
Secondly, we wanted to be sure that Kangas could run in any environment without major setup. Once you’ve run `pip install kangas`, you can run it as a standalone app on your local machine, from within a notebook environment, or even deployed on its own server (as we’ve done at kangas.comet.com .)
Finally, the fact that Kangas is open source means it is by definition interoperable. If your particular needs are so specific and extreme that nothing on the Kangas roadmap will ever satisfy them, you are able to fork the repo and implement whatever you need. And if you do that, please let us know! We’d love to take a look.
What’s on the roadmap for Kangas?
It’s still early days for Kangas. Right now, there are only a handful of beta users testing it, and large portions of the codebase are still under active development. With that in mind, what happens next is largely up to you. Kangas is and always will be a free and open source project, and what we choose to prioritize over the next months and years will come down to what members of the community want the most.
If you have time to spare and a burning need for better exploratory data analysis, consider stopping by the Kangas repo and taking it for a spin. We’re open to community contributions of all kinds, and if you star/follow the repository, you’ll get updated whenever there is a new major release.
Kangas: Visualize Multimedia Data at Scale was originally published in Towards Data Science on Medium, where people are continuing the conversation by highlighting and responding to this story.
from Towards Data Science - Medium
https://towardsdatascience.com/kangas-visualize-multimedia-data-at-scale-db981b5e8d23?source=rss----7f60cf5620c9---4
via RiYo Analytics


No comments