https://ift.tt/Nps1dxn Three-dimensional simplicity: data, technology and people… and a tool to help along the way Image by Alexandre All...
Three-dimensional simplicity: data, technology and people… and a tool to help along the way

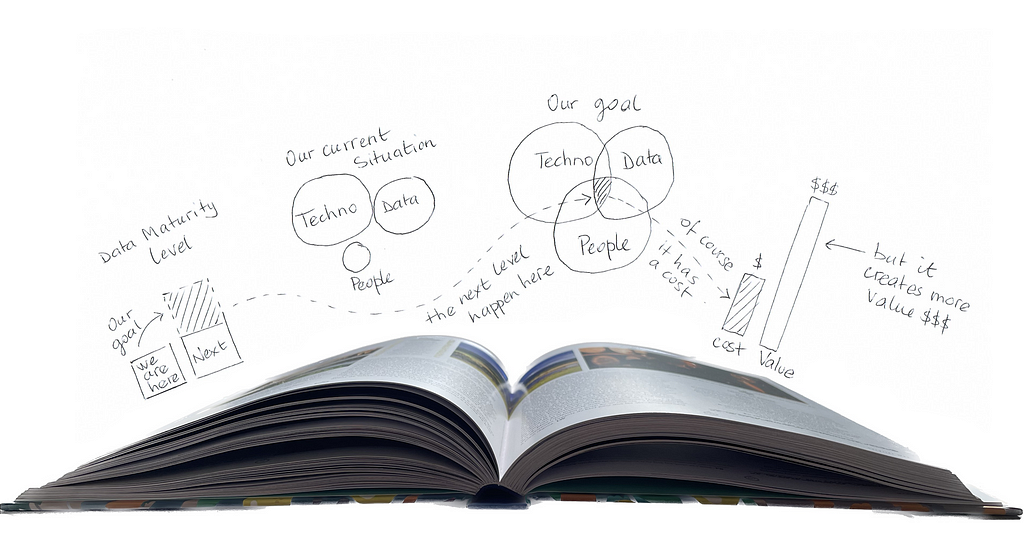
In a previous article, I advocated a simple way to communicate with executives or non-techies by illustrating any data initiative — from transforming your organization into a data-driven entity to developing a new data project — with just three dimensions: data, technology and people (“3D data story”) because, at the end of the day, that’s what it’s all about!
“Life is really simple, but we insist on making it complicated.” — Confucius
In a recent discussion on one of the professional social media regarding these three dimensions, some people suggested adding more to better reflect the business needs. All of us data people love designing complex models, developing elaborate strategies or sophisticated architectures, but we risk losing our audience. The main idea with the three dimensions is to keep our message simple; a message that both management and end users can remember easily: data, technology and people. Easy! This simplicity is key to the majority of staff/users being able to take ownership of it to nurture the organizational culture. Many articles and research show that our short-term memory can actually only store three to five items. Many stories or slogans are based on this rule of three. Funnily enough, it worked so well that Alexandre Dumas titled his book The Three Musketeers while they were actually four (OK this last example could be seen as “confirmation bias” 😉).
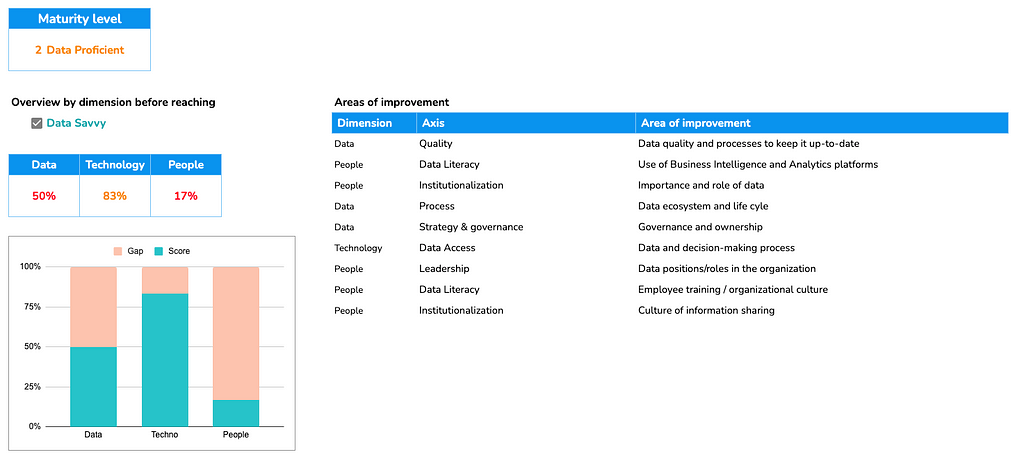
In line with the previous post, I would like to make this article more concrete by proposing a 3D Data Maturity Assessment Tool. The tool allows you to determine the current situation of your organization and what needs to be done, by dimension, to reach the next level. The assessment is based on only 18 questions. If I see people interested in this tool–I will use a middle page to track its activity–I will make it more robust by developing more questions and adding a set of recommendations to reach the next level that will be specific to your current situation — a kind of simple roadmap.
Simplifying how you communicate with management is important, but it obviously needs to be aligned with your organization’s strategic goals. This is exactly the purpose of a data strategy or a business case if it is for a data project. I will not go into detail about that here since it is already well documented on Medium. Rather, I will focus on the elevator pitch instead (but not one of those modern elevators that can reach 500 meters in just 30 seconds!) In other words, your project is not yet approved and you want to make your case.
3D Data Maturity level
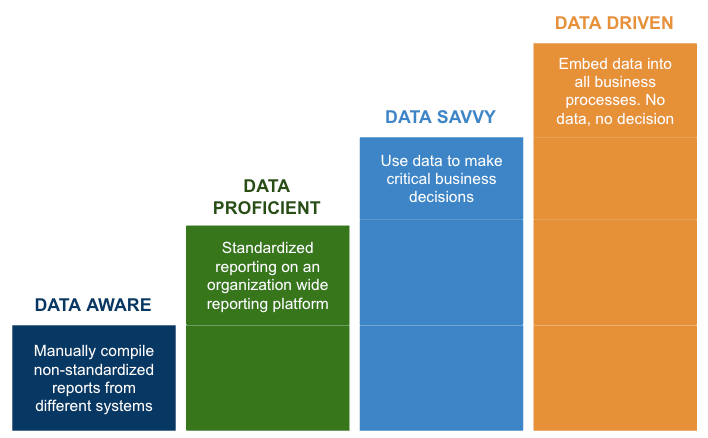
Whether it is for your data strategy or for your business case, you will have to target the level of data maturity that you want to reach. Ideally, to keep the communication simple, you want to define your maturity expectations in terms of data, technology, and people. You can align your 3D Venn diagram with your assessment of where your organization is now, and then identify what is missing to achieve your goal. Let’s start with the data maturity level. There are many models, the best is the one you are most comfortable with. I find the Dell Data Maturity Model simple and relevant, so I will use it for the rest of this article, as well as for the tool.

Each level of the model is built on the previous one. You cannot become data-driven overnight; this is an iterative process that requires investment and energy! Below is a high-level overview of what each level means.
1. Data Aware
Data
- Siloed data managed by individuals or teams
- Multiple data sources from multiple systems
- No single source of truth
Technology
- Multiple BI systems (often based on MS Excel)
- Non-standardized reports compiled manually
- No coherent and structured approach to data storage
- No application/system integration
People
- No trust in data quality and their own reports
- Ad-hoc reporting
- Working in silo
2. Data Proficient
Data
- Siloed data but database design/normalization partially implemented
- Challenges in using/manipulating unstructured data
Technology
- Data warehouse exists but it is incomplete
- BI systems available at organization level
- Acceptable level of reporting standardization
People
- Staff question data quality
- Track of the first organizational KPIs
- Ready to pilot data initiative
- Lack executive sponsorship
- Key people/role understand the value of data to make decisions
3. Data Savvy
Data
- Breaking down organizational and data silos
- Data strategy established
- Single source of truth established
- Data as a product: statistical model/predictive analytics
Technology
- Focus on new technologies and data integration
- Data on demand
- Development of data warehouses/data lakes (unstructured data)
People
- Data used to make critical business decisions for key initiatives
- Executive sponsorship is in place
- Data teams to support and implement the strategy
- Partnership IT and business units
- Organizational culture/understanding of the importance of data
- Staff training available
4. Data-driven
Data
- Scale the data strategy while reducing costs
- Integration of all data sources
Technology
- Advanced analytics platform (moving from descriptive and predictive into prescriptive analytics — machine learning)
- Use-case oriented architecture for the different functional roles
People
- No data means no decision
- IT and business teams functioning as a cohesive unit
- Analytics embedded in business processes
- Data skills as part of staff curriculum/evaluation: a certificate of data literacy
A certificate of data literacy (CDL) is an addition to the model because the human factor is often neglected. So in a fully data-driven organization, I believe that data literacy should be part of each staff member’s curriculum. Therefore, I encourage organizations to implement a mandatory CDL which will greatly contribute to developing the culture of the enterprise.
As mentioned earlier in this article, to help you assess your organization’s maturity level, here is a simple Google spreadsheet tool that you can either use as is–but better if you copy it since it does not support multiple access–or modify it and adapt it to your needs. The purpose here is not to reinvent the wheel, but to structure the data maturity model following the 3D approach to support your story with executives or other stakeholders.

Determining your maturity level requires an honest self-assessment to create a realistic view of your current status. This will inform you about the steps that need to be implemented to reach the next level of data maturity, or the objectives of your data project. Often the human factor, the people dimension, lags behind. Changing culture takes a lot more energy than a technology shift.
“Buying and using analytics tools is not hard, changing behaviors is.” *
* Deloitte Insights | Analytics and AI-driven enterprises thrive in the Age of With (2019)
A good approach is to conduct a staff/user survey in parallel. On the one hand, it will give you an idea of their perception, and can be used to adjust the people dimension. On the other hand, it will serve as a reference for your final evaluation of the project and thus measure its impact.
At this stage, you will be able to establish a draft plan and, above all, its associated cost. The trickiest part now is to estimate the benefits the organization will get from implementing the project. They can take different forms: cost reduction, performance improvement, process optimization, more agility or innovation, etc. If you can’t clearly establish the gain and quantify it, you have to question yourself. Even if the project makes sense from a data perspective, if the business value cannot be estimated and later measured using mutually agreed-upon metrics, your project is at risk.
Completing your story
Now, you can complete your initial story with some more concrete and measurable elements.
- First, you need to focus on the vision–the big picture–that will inspire the decision makers: Why is your proposal relevant? How is it aligned with the strategic objectives?
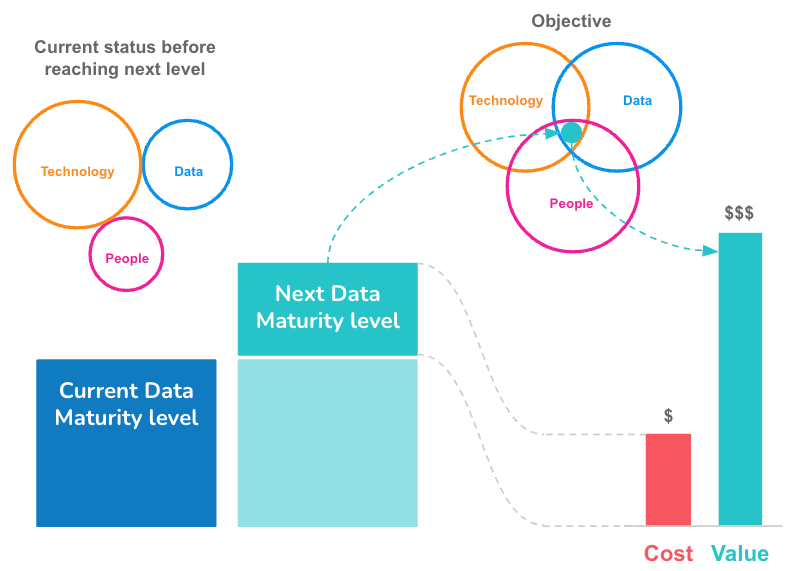
- Then, you must translate this vision into something more concrete, a high-level plan they can quickly grasp: the 3D Venn diagram. Broadly, where should we put our energy to make this project successful? This should lead to a discussion about the cost of the proposal.
- Finally, with the difficult part covered, you can see the happy ending: the value added to the project. What will be the benefits and its return on investment?
Your story can almost fit in three slides, the last one could be summarized as follows:

References and acknowledgments
- Confucius ;-)
- Dell Data Maturity Model
- Hesa toolkit
- Fujitsu Data Maturity Self-Assessment
- Thanks Vijay Yadav for initiating a name (3D…)
- Thanks Sharon for your continuous support
Pitching Your Data Strategy: Translating Tech Talk for Management and Users was originally published in Towards Data Science on Medium, where people are continuing the conversation by highlighting and responding to this story.
from Towards Data Science - Medium https://ift.tt/V0oxtDM
via RiYo Analytics

No comments