https://ift.tt/1Pczi4J Wastewater RNA + Time = Very Strong Outcome Predictions Combining wastewater RNA level with overall pandemic time y...
Wastewater RNA + Time = Very Strong Outcome Predictions
Combining wastewater RNA level with overall pandemic time yields very high predictions of COVID-19 disease outcomes

Summary
In a previous article, I showed that the Biobot dataset of SARS-CoV-2 wastewater levels provides strong predictions of COVID-19 disease outcomes in the United States. But there are likely more factors in predicting hospitalization and death than just RNA markers in sewage. Some obvious candidates are vaccination, previous infection, and advances in medical treatment.
I tested several metrics against this hypothesis, taking these factors into account to varying degrees. The metric I found that most accurately correlates with COVID-19 disease outcomes is wastewater RNA plus calendar time since the start of the pandemic. The correlation is significantly stronger than wastewater alone. I named this new metric RNA Plus Time (RPT) and calculated it with this Python/pandas code.
RPT captures the fact that a given wastewater RNA level early in the pandemic precedes more hospitalization and death than the same RNA level later in the pandemic. The intuitive explanation is that as the 30 months of the pandemic have marched on, more people are vaccinated, more people have a previous infection, doctors are better at treating sick people, there are better therapeutic drugs, and (sadly) many of the most vulnerable have already died.
Background
My previous article showed a strong statistical correlation between wastewater (sewage) SARS-CoV-2 RNA levels and COVID-19 disease outcomes. I found Spearman correlations of about 0.8 (out of 1.0) between US wastewater and hospitalization from COVID-19. I found similar results for mortality from the disease.
But certainly there are more factors in predicting disease outcome than just wastewater virus levels. Imagine two populations with the same virus level, but one population is completely susceptible while the other is 100% vaccinated and each person has a doctor standing by their side.
For this project, I sought to improve the predictive power of wastewater by combining the measured virus levels with other information.
Wastewater and Outcome Datasets
I took wastewater data from Biobot’s regional summary dataset, which rolls up many individual water treatment plants into a whole-country aggregate that is smoothed over several weeks and weighted for population near the water test sites.
I took COVID-19 disease outcomes from CovidActNow and added rolling averages for hospital admissions, hospital beds in use, ICU beds in use, and deaths.
When joining the water tests with disease outcomes, I used date look-ahead so the merged dataset has hospitalization statistics that are 14 days after a water test and mortality counts that are 28 days after each water test.
A New Metric: RNA Plus Time (RPT)
My goal was to create a new metric that includes wastewater RNA levels and combines it with other data. I experimented with various approaches and compared their predictive power for disease outcomes. The best formula I tested was the addition of calendar time, which covers increasing vaccination, boosting, natural infections, advances in medical treatments, and the sad fact that the most vulnerable people die early in a pandemic.
I assigned wastewater RNA on a scale of 0 to 100, where 100 is the most RNA found. I assigned “inverse time within the pandemic” also on a 0 to 100 scale, where 100 is the start of the pandemic in the US and 0 is today. Adding these two items together yields a metric from 0 to 200, where 200 is the worst disease outlook — high wastewater RNA within a fully vulnerable population.
One detail I worked out is that the highest RNA levels are outliers. If they are assigned a value of 100, most wastewater values will be very low on a 0 to 100 scale. So I compressed the top 10% of the RNA values to the 90% level.
RNA_TOP_COMPRESSION = 0.90
top_rna = BiobotDF["effective_concentration_rolling_average"].quantile(RNA_TOP_COMPRESSION)
BiobotDF["rna_signal_pct"] = (BiobotDF["effective_concentration_rolling_average"] / top_rna) * 100
BiobotDF.loc[BiobotDF["rna_signal_pct"] > 100, "rna_signal_pct"] = 100
Calendar time was set to the percent of pandemic weeks remaining at the time of the wastewater sample.
VIRUS_START = "2020-03-01"
pandemic_weeks = int(round(((pd.Timestamp.today() - pd.Timestamp(VIRUS_START)) / np.timedelta64(1, 'W'))))
UsaDF['pandemic_week'] = ((UsaDF.week - pd.Timestamp(VIRUS_START)) / np.timedelta64(1, 'W')).round().astype(int)
UsaDF["pandemic_pct"] = ((UsaDF['pandemic_week'] / pandemic_weeks) * 100).round(2)
UsaDF["pandemic_pct_inv"] = 100 - UsaDF["pandemic_pct"]
RNA Plus Time (RPT) is then a simple addition of these two factors.
UsaDF["RPT"] = (UsaDF["pandemic_pct_inv"] + UsaDF["rna_signal_pct"]).round(2)
Comparing the Predictions
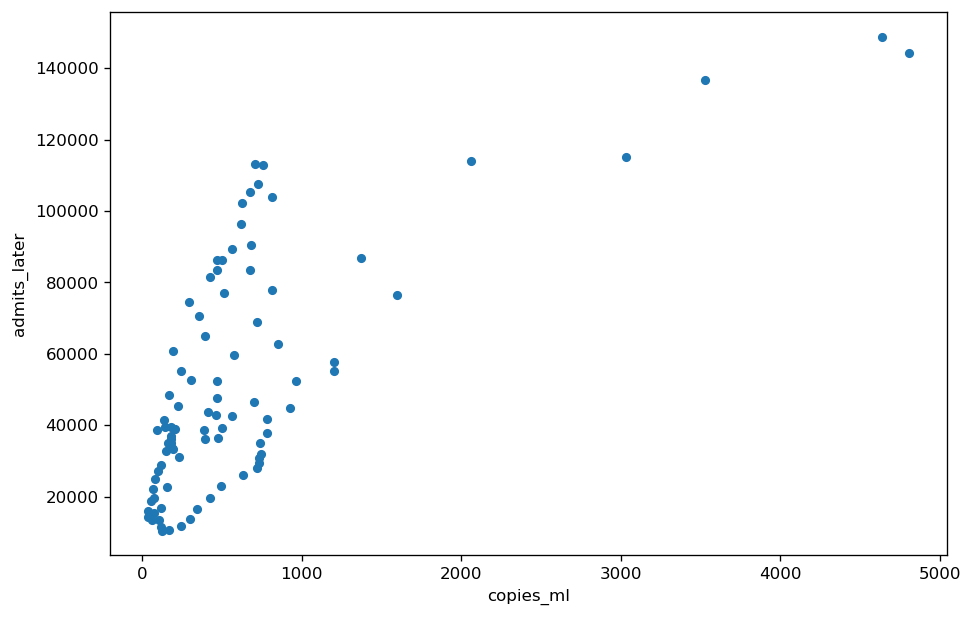
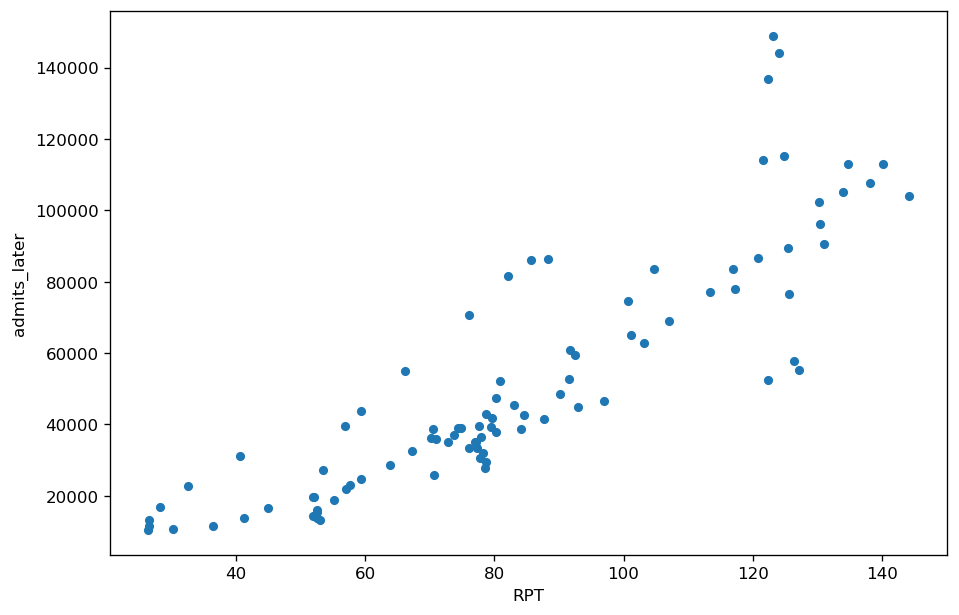
To see the predictive power that RPT adds to wastewater data, consider the two scatter plots below, which display 121 nationwide wastewater values from April 2020 to July 2022.
The first plot is simply copies per milliliter of wastewater SARS-CoV-2 RNA versus hospital admissions for COVID-19 two weeks later. Notice that since some water samples have very high concentrations of RNA most of the data clumps on the far left.
The second plot is RNA Plus Time (RPT) for the same data. There are two improvements. First, since very high RNA levels are compressed before adding pandemic time, the data is more evenly distributed along the x-axis. Second, the addition of a time factor puts each wastewater measurement in the context of the overall pandemic, making it more meaningful.
The Spearman correlations of the data in the scatter plots confirm the tighter relationship of RPT with severe disease outcomes. The first row below is for the hospital admission scatter plots. The other rows are for hospital beds in use for COVID-19, ICU usage, and deaths. All the rows show substantially improved correlations with RPT compared to wastewater virus only. Correlation values near 0.9 are very strong.
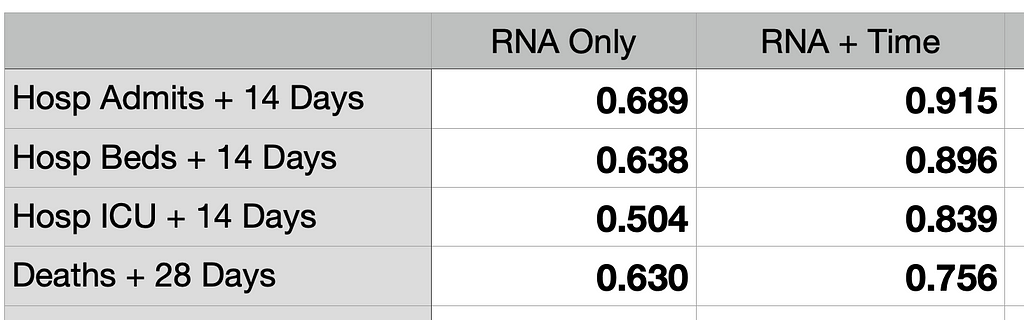
A careful reader might note that the correlations for wastewater RNA-only (second column above) are lower than those cited in my previous article. The reason is that the dataset used here covers a longer timespan and includes the recent BA.5 wave, which has high wastewater RNA levels but relatively low severe disease outcomes. This is additional evidence that RNA Plus Time is a more accurate disease predictor than RNA-only.
For More Information
https://link.springer.com/article/10.1007/s13762-022-04326-1 (review of the scientific literature about wastewater monitoring of SARS-CoV-2)
https://en.wikipedia.org/wiki/Correlation (Spearman and Pearson correlation)
https://biobot.io/science/ (technical articles from Biobot)
https://data.cdc.gov/Public-Health-Surveillance/NWSS-Public-SARS-CoV-2-Wastewater-Metric-Data/2ew6-ywp6. (CDC wastewater tracking)
Wastewater RNA + Time = Very Strong Outcome Prediction was originally published in Towards Data Science on Medium, where people are continuing the conversation by highlighting and responding to this story.
from Towards Data Science - Medium https://ift.tt/LF9shUE
via RiYo Analytics


No comments