https://ift.tt/vxzaiOT A comprehensive guide on Python concepts and questions from top companies for all the budding Data Engineers to help...
A comprehensive guide on Python concepts and questions from top companies for all the budding Data Engineers to help them in preparing for their next interview.

Today we are going to cover interview questions in Python for a Data Engineering interview. This article will cover concepts and skills needed in Python to crack a Data Engineering interview. As a Data Engineer, you need to be really good in SQL as well as Python. This blog will cover only Python, but if you are interested to know about SQL, then there is a comprehensive article “Data Engineer Interview Questions”.
Python ranks on top of PYPL-Popularity of Programming Language Index, based on the analysis of how often tutorials of various programming languages are searched on Google. Python is top among many other languages for Data Engineering and Data Science.
The Data Engineers typically work on various data formats and Python makes it easier to work with such formats. Also, Data Engineers are required to use APIs to retrieve data from different sources. Typically the data is in JSON format and Python makes it easier to work with JSON as well. Data Engineers not only extract the data from different sources but they are also responsible for processing the data. One of the most famous data engines is Apache Spark, if you know Python, you can very well work with Apache spark since they provide an API for it. Python has become a must have skill for a Data Engineer in recent times! Let’s see what makes a good data engineer now.
What Makes a Good Data Engineer
Data Engineering is a wide discipline with many different roles and responsibilities. The ultimate purpose of Data Engineering activity is to have a consistent flow of data for the business that enables data driven decision making in organization and also aids in making machine learning for the Data Scientists/Analysts.
This data flow can be accomplished in many different ways and one of the ways is using Python.
A good data engineer should be able to:
- Build and maintain the database systems
- Be Proficient in SQL and Python
- Build Data Flow Pipelines
- Understand the Cloud Architecture and System Design concepts
- Understand Database Modeling
Apart from the technical skills, a good Data Engineer will also possess excellent communication skills. These skills are especially required when you are explaining the concepts to the non-technical audience in the company. Now that you know what makes a good Data Engineer, let’s see how Python is used by the Data Engineers.
Python for Data Engineers

Now that you have an overview of what makes a good Data Engineer, let’s see how Python is used by the Data Engineers and how significant it is. The most critical use of Python for Data Engineers is building Data and Analytics pipelines. These pipelines take data from multiple sources and transform it into usable format and drop it into a Data Lake or a Data Warehouse so that Data Analysts and Data Scientists can consume the data.
- For many reasons, Python is a popular language among Data Engineers due to its ease of use and utility. It is one of the top three leading programming languages in the world. In fact, it’s the second most used programming language according to the TIOBE Community in Nov 2020.
- Python is used widely in Machine learning and AI. Data Scientists and Data Engineers work very closely when the machine learning models are needed in production. Thus, having a common language between Data Engineers and Data Scientists is a plus point.
- Python is a general purpose language and it provides a lot of Libraries for accessing databases and storage technologies. It’s a very popular language for running ETL jobs.
- Python is used in various applications and technologies and one such application is its use in Data engines such as Apache Spark. Spark has an API through which Data Engineers can run the Python codes.
Thus, Python has become extremely popular among all the Data Engineers due to it’s versatile nature.
Now it’s time to move to hands-on practice on Python. There is another article on StrataScratch which focuses on Python Interview Questions for Data Scientists. That article has a comprehensive list of Python questions focusing on a Data Science interview.
Python Data Engineer Interview Questions for Practice
Python Data Engineer Interview Question #1: Workers with highest salary
Link to the question: https://platform.stratascratch.com/coding/10353-workers-with-the-highest-salaries
Question:

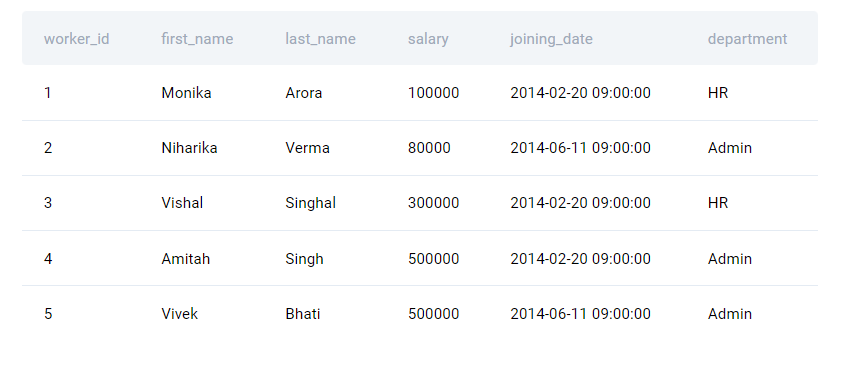
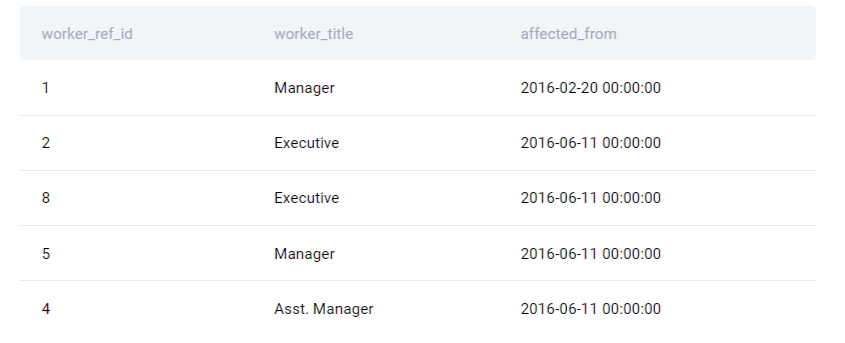
The question asks you to find the worker titles that earn the highest salary. In this question, there are two tables.
Worker:
Title:
Approach:
There are two tables; worker and title and they both can be joined by worker_id and worker_ref_id. For joining the tables in pandas, let’s make the column names consistent. Let’s change the name from worker_ref_id to worker_id in the title table using the ‘rename’ function.
# Import your libraries
import pandas as pd
# Change the columm name
title_worker_id = title.rename(columns = {'worker_ref_id':'worker_id'})
Using pandas ‘merge’ function, join the two tables on worker ID to get IDs and titles in the same data frame. Save the result of the join into a different data frame.
merge_df = pd.merge(worker, title_worker_id, on = 'worker_id')
Check the maximum salary:
merged_df['salary'].max()
Check the rows corresponding to maximum salary:
rows_with_max_salary = merged_df[merged_df['salary'] == merged_df['salary'].max()]
The questions asks only for the worker title and thus, we will be selecting only worker titles from the above data frame.
result = rows_with_max_salary['worker_title']
Final Code:
Below is the final code for this python data engineer interview Question. Note that you should import all the relevant/necessary libraries at the top.
# Import your libraries
import pandas as pd
# Change the columm name
title_worker_id = title.rename(columns = {'worker_ref_id':'worker_id'})
merged_df = pd.merge(worker, title_worker_id, on = 'worker_id')
# Get Max Salary
rows_with_max_salary = merged_df[merged_df['salary'] == merged_df['salary'].max()]
result = rows_with_max_salary['worker_title']
Code Output:

Python Data Engineer Interview Question #2: Activity Rank
Link to the question: https://platform.stratascratch.com/coding/10351-activity-rank
Question:
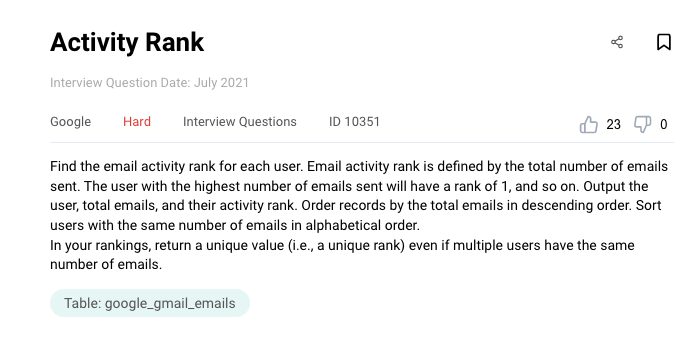
This python data engineer interview question has one table with 4 fields.
google_gmail_emails
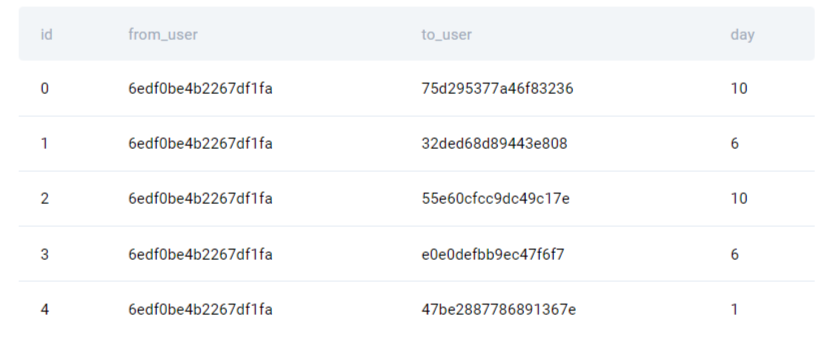
We need to find the email activity for each user and then rank all the users based on their email activity in the descending order. If there are users with the same email activity, then rank those users alphabetically.
Approach
First step is to calculate the email activity by each user. We will be using the ‘groupby’ function from pandas to group by users and then count the number of emails sent by that user. The result will be a series, thus we need to convert it into the Data Frame by using the ‘to_frame’ function and then reset indexes.
After that, sort the data based on the total emails sent in the descending order and if any two users have the same email sent, then sort it by ‘from_user’ in the ascending order. To incorporate this in the code, we are going to use sort_values which will take two variables in the first argument and ‘True/False’ values in the ‘ascending’ argument of the function.
# Import your libraries
import pandas as pd
# Start writing code
df = google_gmail_emails
df1 = df.groupby('from_user').id.count().to_frame('total_emails').reset_index().sort_values(['total_emails','from_user'],ascending=[False,True])
Once we have the data sorted based on the email activity and user, it’s time to rank the data. This is similar to using RANK() OVER() functions in SQL. Pandas has a function called ‘rank()’ which takes multiple arguments.
For the rank() function, the first argument is a method which will be equal to ‘first’. There are multiple methods rank() function provides, you can check the details here. ‘First’ method ranks are assigned in order they appear in the array which suits our needs.
df1['rank'] = df1['total_emails'].rank(method='first',ascending = False)
Thus, we have the rank for each user based on the total emails sent. In case where the number of emails sent is equal, then we have sorted alphabetically based on the from_user field.
Final Code:
Don’t forget to include the comments in your code for better readability.
# Import your libraries
import pandas as pd
# Start writing code
df = google_gmail_emails
# Group by from_user
# Count IDs
# Convert to Data Frame using to_frame
# Sort data using sort_values()
df1 = df.groupby('from_user').id.count().to_frame('total_emails').reset_index().sort_values(['total_emails','from_user'],ascending=[False,True])
# Rank() the data
df1['rank'] = df1['total_emails'].rank(method='first',ascending = False)
df1
Code Output:
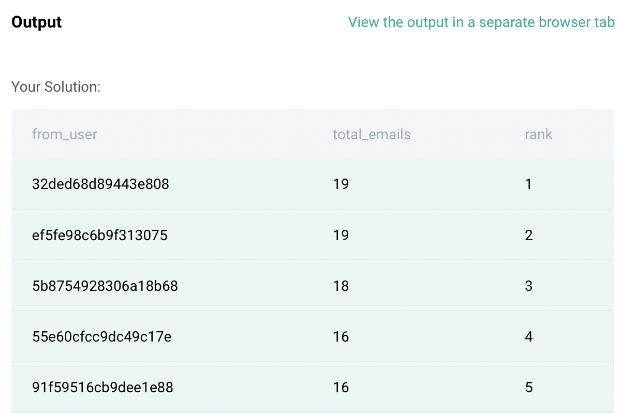
Python Data Engineer Interview Question #3: Completed Tasks
Link to the question: https://platform.stratascratch.com/coding/2096-completed-tasks
Question:
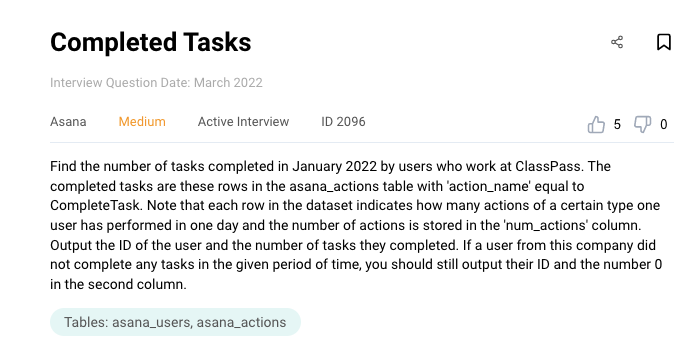
There are two tables for this question.
Asana_Users
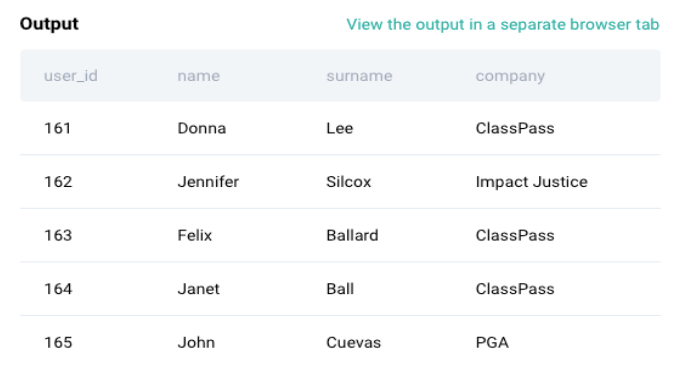
This table has user IDs and user information such as name, surname and company.
Asana_Actions
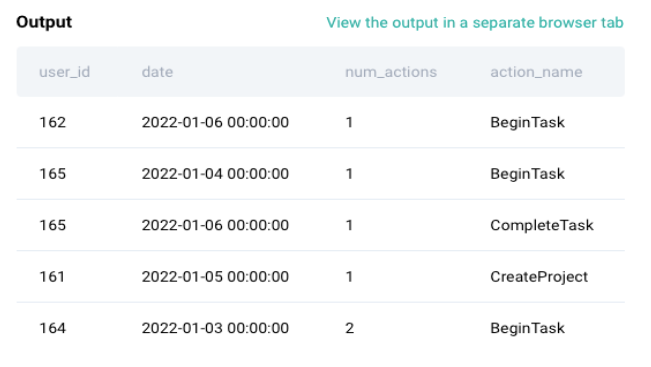
This looks like an events table where each row represents an action by a specific user, number of actions by users and the action name.
Approach:
There are two tables; asana_users and asana_tables. So the first step is to join both the tables on the user_id.
# Import your libraries
import pandas as pd
# Start writing code
asana_actions.head()
df = asana_users.merge(asana_actions, left_on = 'user_id', right_on = 'user_id', how = 'left')
We need only focus on the ClassPass company. Thus, filter this data frame only for ClassPass.
df = df[df['company'] == 'ClassPass']
We need to focus only on Jan 2022, thus filter the data frame for that. We can use a function in pandas ‘to_period’.
df = df[df['date'].dt.to_period('m') =="2022-01"]
Once we have filtered for ClassPass and the month of Jan, it’s time to calculate the number of actions by each user. You can use the groupby function from pandas.
df = df.groupby(['user_id','action_name'])['num_actions'].sum().unstack().fillna(0).reset_index()
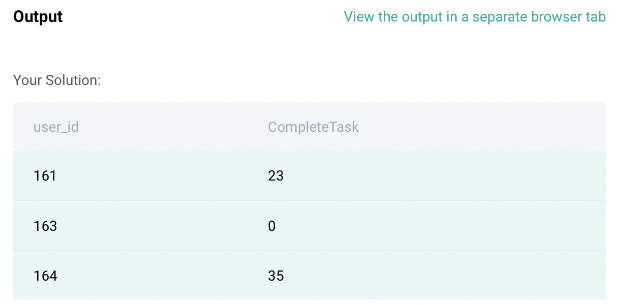
Lastly, we need to select only two columns; user_id and CompleteTask. Let’s do that!
df = df[['user_id','CompleteTask']]
Final Code:
# Import your libraries
import pandas as pd
# Start writing code
asana_actions.head()
df = asana_users.merge(asana_actions, left_on = 'user_id', right_on = 'user_id', how = 'left')
df = df[df['company'] == 'ClassPass']
df = df[df['date'].dt.to_period('m') =="2022-01"]
df = df.groupby(['user_id','action_name'])['num_actions'].sum().unstack().fillna(0).reset_index()
df = df[['user_id','CompleteTask']]
df
Code Output:
Python Data Engineer Interview Question #4: Number of Streets per Zip Code
Link to the question: https://platform.stratascratch.com/coding/10182-number-of-streets-per-zip-code
Question:
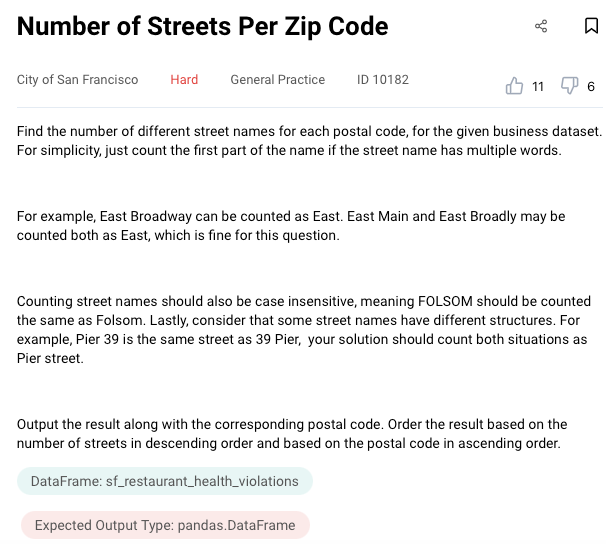
In this python data engineer interview question, we need to count the number of street names for each postal code with some conditions given in the question. For example, we need to just count the first part of the name if the street name has multiple words (East Main can be counted as East).
This question helps you to practice splitting and manipulating text for analysis.
There’s one table to solve this question:
Sf_restaurant_health_violations

Approach:
We need to split the business address to get the first part of the street name. For example, ‘350 Broadway St’ street name can be split into different elements using a split function. Let’s use list comprehension (Lambda function) to create a function on the go.
df = sf_restaurant_health_violations
df['street'] = df['business_address'].apply(lambda x: x.split(' '))
The output of the above code will give a list of elements. The string will be broken down into multiple elements and it will depend on the type of delimiter used. In this case, we have used ‘space’ as a delimiter and thus, ‘350 Broadway St’ will be converted to a list as [ “350”, “Broadway”, “St” ].
The question mentions case insensitive street names thus we need to lower() or upper() all the street names. Let’s use lower case for this question. Also, the first element of the list should be a word so in cases where the first element is a digit, then we take the next element. Below is the code implemented for this.
df['street'] = df['business_address'].apply(lambda x: x.split(' ')[1].lower() if str(x.split(' ')[0][0]).isdigit() == True else x.split(' ')[0].lower())
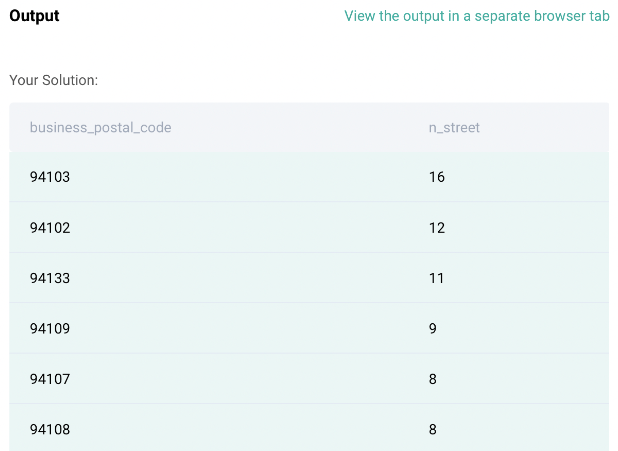
Now find the number of non-uniques street names. After the group by function, the data is converted to a series and thus, we need to_frame function to convert it back to a data frame. Let’s give the name to the number of streets as ‘n_street’ and sort it in descending order by using the sort_values function.
result = sf_restaurant_health_violations.groupby('business_postal_code')['street'].nunique().to_frame('n_street').reset_index().sort_values(by='business_postal_code', ascending=True).sort_values(by='n_street',ascending=False)
Final Code:
import pandas as pd
df = sf_restaurant_health_violations
df['street'] = df['business_address'].apply(lambda x: x.split(' ')[1].lower()
                if str(x.split(' ')[0][0]).isdigit() == True else x.split(' ')[0].lower())

result = sf_restaurant_health_violations.groupby('business_postal_code')['street'].nunique().to_frame('n_street').reset_index().sort_values(by='business_postal_code', ascending=True).sort_values(by='n_street',ascending=False)
Code Output:
Python Data Engineer Interview Question #5: Consecutive Days
Link to the question: https://platform.stratascratch.com/coding/2054-consecutive-days
Question:
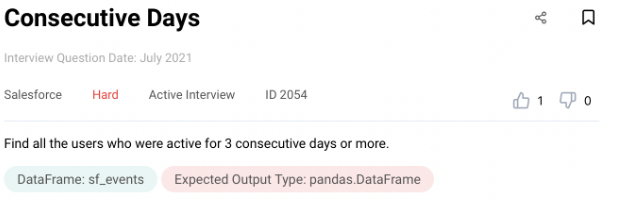
This question has one table as below.
sf_events
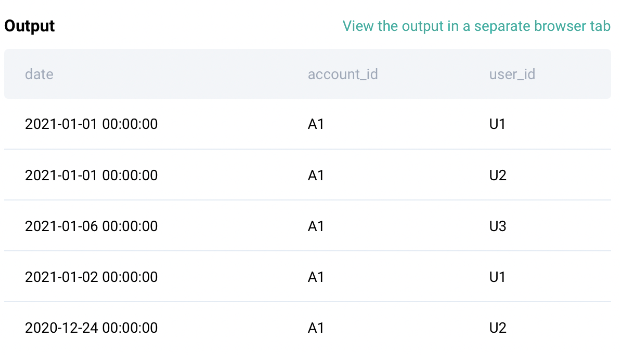
In this question, you need to find all the users who are active for three consecutive days.
Approach:
Firstly, this is the events table without any unique identifier such as event_id. So let’s drop duplicates from this table if any using the drop_duplicates() function in pandas.
# Import your libraries
import pandas as pd
# Start writing code
df = sf_events.drop_duplicates()
In this table, we have user IDs, account IDs and dates but we only need two columns as per the question; user ID and dates. Let’s select only those two columns and sort the data for each user and each date in the ascending order using sort_values() function from pandas.
df = df[['user_id', 'date']].sort_values(['user_id', 'date'])
In the next step, you will need to think about a function that is similar to LEAD() or LAG() in SQL. There is a function called SHIFT() which can help us move the dates. This function takes a scalar parameter called the period, which represents the number of shifts to be made over the desired axis. This function is very helpful when dealing with time-series data. Let’s use this function and create another column by adding 2 more days to it since we need users who are active 3 consecutive days.
df['3_days'] = df['date'] + pd.DateOffset(days=2)
df['shift_3'] = df.groupby('user_id')['date'].shift(-2)
# Check Output
df.head()
Output from the above steps:
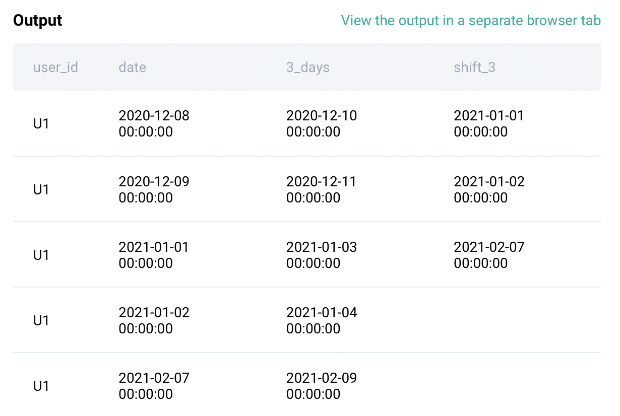
Now that we have the data in the format we need, let’s compare the columns ‘3_days’ and ‘shift_3’ and see if they are equal. If they are equal then we extract the corresponding user ID since that’s what the question asks.
df[df['shift_3'] == df['3_days']]['user_id']
Final Code:
# Import your libraries
import pandas as pd
# Start writing code
df = sf_events.drop_duplicates()
df = df[['user_id', 'date']].sort_values(['user_id', 'date'])
df['3_days'] = df['date'] + pd.DateOffset(days=2)
df['shift_3'] = df.groupby('user_id')['date'].shift(-2)
df[df['shift_3'] == df['3_days']]['user_id']
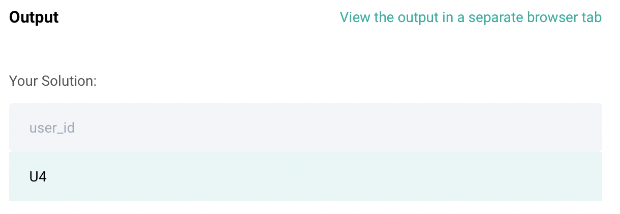
Code Output:
Python Data Engineer Interview Question #6: Ranking Hosts by Bed
Link to the question: https://platform.stratascratch.com/coding/10161-ranking-hosts-by-beds
Question:
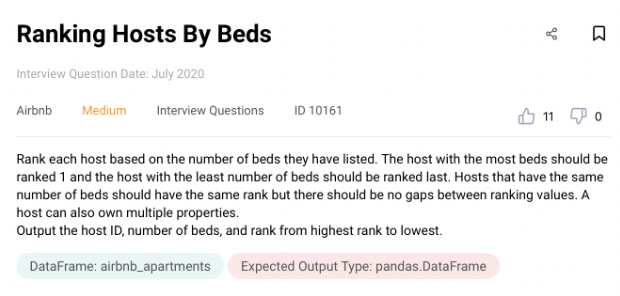
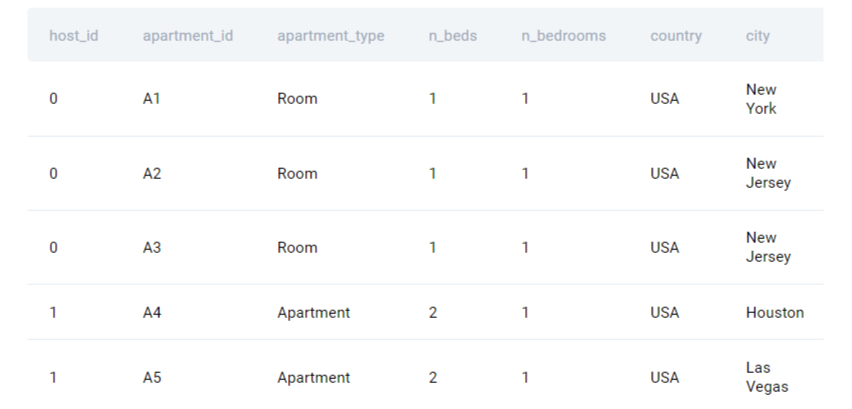
There is one table provided to solve this question. In this question, we need to rank hosts based on the number of beds they have listed. One host might have multiple listings. Also, some hosts might have the same number of beds so the rank for them should be the same. Please have a look at the sample output from the table provided:
airbnb_apartments
Approach:
As a first step we need to find the total number of beds listed by each host. The question mentions that one host might have multiple properties listed, thus, we need to add the number of beds by each host by using a groupby() function in python and then convert the result into the data frame
# Import your libraries
import pandas as pd
# Start writing code
result = airbnb_apartments.groupby('host_id')['n_beds'].sum().to_frame('number_of_beds').reset_index()
Next step is to rank the hosts based on the number of beds listed by them. We already have the host and the number of beds columns calculated in the previous steps. Let’s use the rank() function with the Dense method since we need to provide the same rank to the hosts which have the same number of beds listed on the website.
result['rank'] = result['number_of_beds'].rank(method = 'dense', ascending = False)
Lastly, we need to sort the data based on the rank in ascending order. Let’s use sort_values() to sort the data in the ascending order of the rank for each host.
result = result.sort_values(by='rank')
Final Code:
# Import your libraries
import pandas as pd
# Start writing code
result = airbnb_apartments.groupby('host_id')['n_beds'].sum().to_frame('number_of_beds').reset_index()
# Rank
result['rank'] = result['number_of_beds'].rank(method = 'dense', ascending = False)
result = result.sort_values(by='rank')
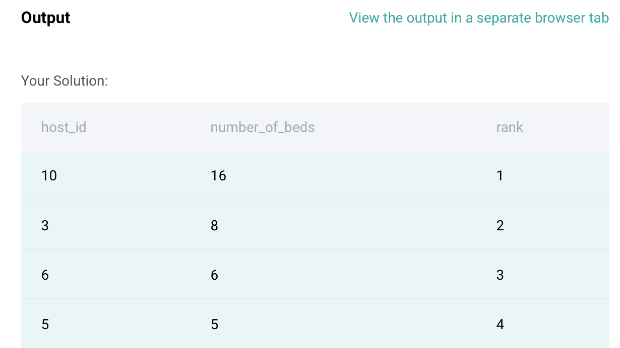
Code Output:
Python Data Engineer Interview Question #7: Expensive Projects
Link to the question: https://platform.stratascratch.com/coding/10301-expensive-projects
Question:
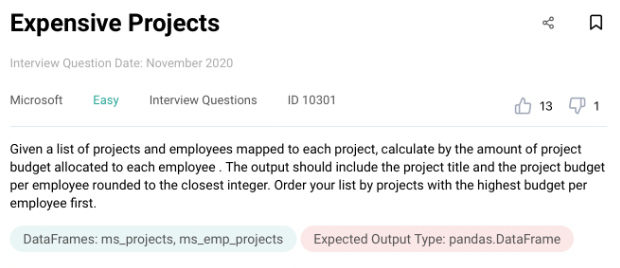
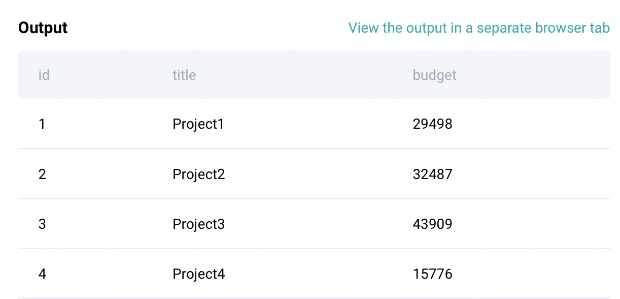
There are two tables for this question. The first table called ‘project_title’ has the name/title of the project, project ID and its budget.
ms_projects
The next table is called ‘ms_emp_project’, which has employee ID mapped to each project ID.
ms_emp_projects
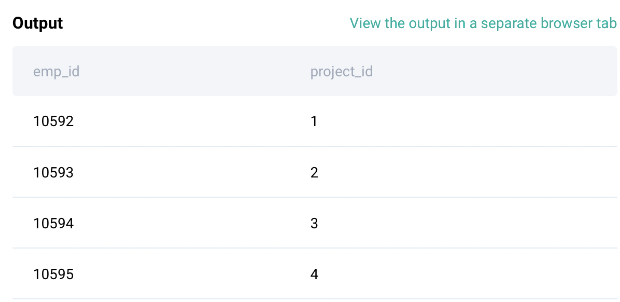
The question asks you to calculate the amount of project budget allocated to each employee.
Approach:
There are two tables in the question, each having different information. So the first step is to join both the tables on the project ID. We are going to use merge() function to join the tables together. The result will be a data frame and let’s save that to a variable called df.
# Import Libraries
import pandas as pd
# Start writing code
df= pd.merge(ms_projects, ms_emp_projects, how = 'inner',left_on = ['id'], right_on=['project_id'])
Next step is to count the total number of employees in each project. Thus, we will be using a groupby() function and group the data by project title and the budget and calculate the number of employees allocated to each project. We will reset the indexes of the resulting data frame and save it in a new variable called df1.
df1=df.groupby(['title','budget'])['emp_id'].size().reset_index()
Next step, we will calculate the budget per employee. To do that, we will divide the total budget by the number of employees allocated for a specific project. We will round this to the nearest integer as mentioned in the question.
df1['budget_emp_ratio'] = (df1['budget']/df1['emp_id']).round(0)
Next step is to sort the data based on the budget allocated per employee in the descending order. We will be using the sort_values() function to do that to keep the ‘ascending’ argument of the function to FALSE since we need descending order.
df2=df1.sort_values(by='budget_emp_ratio',ascending=False)
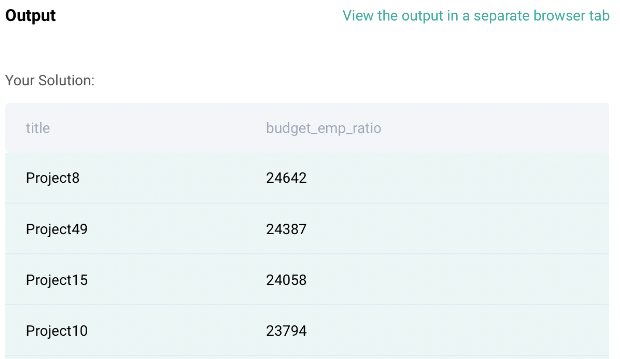
Lastly, the question mentions only to have title and budget per employee as an output and thus, we will be selecting only those columns in pandas using df[[ ]] syntax.
result = df2[["title","budget_emp_ratio"]]
Final Code:
# Import your libraries
import pandas as pd
# Start writing code
df= pd.merge(ms_projects, ms_emp_projects, how = 'inner',left_on = ['id'], right_on=['project_id'])
df1=df.groupby(['title','budget'])['emp_id'].size().reset_index()
df1['budget_emp_ratio'] = (df1['budget']/df1['emp_id']).round(0)
df2=df1.sort_values(by='budget_emp_ratio',ascending=False)
result = df2[["title","budget_emp_ratio"]]
Code Output:
That’s the end of Python Coding hands-on exercise. We hope that you are feeling confident. If you need more practice, there is a comprehensive list of python interview questions you can refer to.
Conclusion
We hope you got a good flavor of what to expect in your next Data Engineering interview. In this article we have looked at various aspects of the Data Engineering interview. We looked at what makes a good Data Engineer, what skill sets are needed and deep dived into Python and its significance to the Data Engineers along with some hands-on practice.
Python Data Engineer Interview Questions was originally published in Towards Data Science on Medium, where people are continuing the conversation by highlighting and responding to this story.
from Towards Data Science - Medium https://ift.tt/Rtaedl9
via RiYo Analytics

No comments