https://ift.tt/CImfOxu image source How to Get the Most out of GrowthBook An open source approach to streamlining A/B testing GrowthBo...

How to Get the Most out of GrowthBook
An open source approach to streamlining A/B testing
GrowthBook is an open source tool for AB testing offering both feature flagging functionality and analysis tooling. The analysis tooling, which is the focus of this article, sits over the top of your data warehouse and interacts through SQL queries with any existing data you’re collecting on your users. This flexibility was one of the main draws of GrowthBook for us as it means that we’re able to directly analyse the impact of our experiments on our business KPIs.
Being open source you get loads of flexibility to configure GrowthBook in a way that works (or doesn’t work!) for you. In this article I’ll cover how we configured our instance of GrowthBook to form the basis of our self-serve experimentation platform at Typeform and includes my top tips for ensuring robustness, usability, and efficiency.
Data Sources
Data sources are essentially SQL views of your data warehouse that pull your experiment feature flags into GrowthBook
The most important thing to get right when setting up GrowthBook is deciding on the structure of your data sources. It’s important to note that metrics are linked to specific data sources and you can’t share those metrics between experiments defined on different data sources.
We’re using GrowthBook to analyse experiments run both online and email campaigns launched through Iterable and we wanted to use the same KPIs across both. One of the latest releases (1.3.0) allows multiple queries per data source and this allowed us to expose multiple types of experiments under one data source and therefore share metrics between them.
We’ve partitioned our data sources by identifier id:
- user_id or account_id for signed in users
- form_uid for new form features
- an anonymous cookie id for visitors to the public site.
Our main KPIs are similarly partitioned between identifiers so this works well for us.
Metrics
Metrics are defined as SQL queries that can pull in data from anywhere in your data warehouse
One of the great advantages of GrowthBook is that metrics are defined through the UI as SQL queries and you can query any table in your data warehouse.

You can define the metric directly through the SQL in GrowthBook itself or pull in any predefined metrics straight from your data warehouse. This is a similar approach to Eppo but has distinct advantages over Optimizely because it puts the metric definitions in that hands of the data team.
At Typeform we’re big fans of dbt and have many dbt models to define different metrics and KPIs and our data warehouse landscape evolves over time. GrowthBook makes it super easy to keep the metrics used for experimentation up to date with the rest of the business.
Metric Tags
Each metric can be tagged and these tags can be used to filter and search the metric catalogue to find the metric that you’re looking for. I especially like this feature because I was one of the users that requested it along with allowing different coloured tags for different applications (introduced in v1.2.0)!
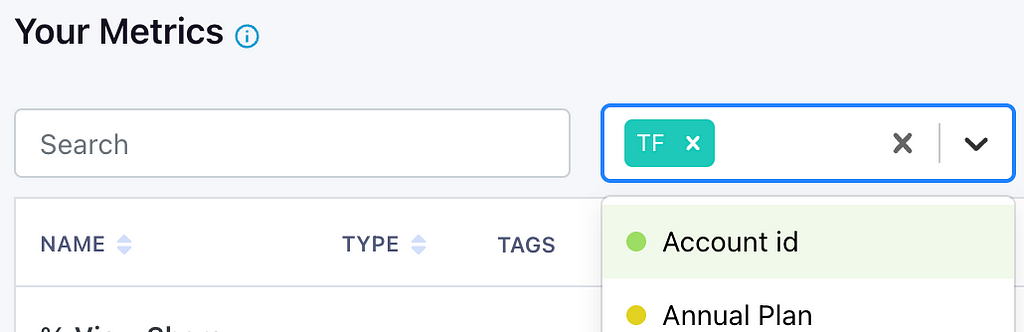
We use various different tags but we have compulsory tags that all metrics must have and these partition our metric catalogue to improve searchability.
Identifier ID: The type of identifier that is used in the targeting and feature flagging. Metrics are defined on just one of these and each is linked to specific data source.

Product: Typeform also has a product called Videoask and this has its own set of metrics and data sources.

Versioning: GrowthBook doesn’t support proper version controlling but we’ve introduced version control tags that let our users know what checks have been performed on the metric. These allow us ensure all our metrics are up to date with our data warehouse and help us adopt new features as GrowthBook introduces them.

Guardrails
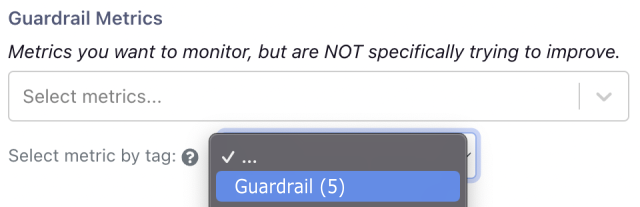
We’re working on standardising our guardrail metrics that should be applied to all our experiments. This will ensure that we never inadvertently impact our KPIs negatively without realising. GrowthBook allows you to add metrics to an experiment by tag so having a guardrail tag means we can easily ensure we’re monitoring those most important metrics.
Custom Identifier Types
Identifier Types are the entities that you use to split you audience between control and variant — this could be a user id, anonymous cookie id, or location.
Version 1.3.0 introduced custom identifier types — allowing you to choose what to call the identifier that is used in your feature flagging. In previous versions you had 2 choices: user_id and anonymous_user_id. We had to alias our other ids onto one of these which caused a lot of confusion.
We’re currently in the process of migrating from a numeric account_id to an alpha-numeric account_uid (apparently we ran out of numbers ¯\_(ツ)_/¯) so being able to explicitly label which one is being used is super useful. Great new feature!
Dynamic Date Ranges
In November 2021 GrowthBook introduced SQL placeholders for dates. These allow you to apply date filters to a metric that get populated with experiment-specific dates. For us this is especially important when querying data from partitioned tables which typically contain 100s millions of rows. Here is an example filter on the partition key day:
WHERE day BETWEEN DATE('') AND DATE('')
An important note here is that both startDate and endDate are timestamps and not dates hence we have to use the DATE() function to match the partition. Also when evaluating the metric the endDate gets replaced with the timestamp of the end of the experiment PLUS the conversion window. If you add an endDate to your data source queries then the actual end date of the experiment is used to filter assignments to your experiment.
Status Updates
One challenge that we faced was anticipating and preventing metrics from breaking to reduce friction for stakeholders. There are 2 main reasons that metrics break:
- Changes to our data warehouse. We have a very active dbt environment that calculates our KPIs and these often migrate as the business requirements change.
- Typos in the SQL. It is fairly easy to introduce typos when copying sql from DataGrip into GrowthBook or accidentally editing the sql of an existing metric.
One super nice feature of GrowthBook being open source is that you can download a config.yml file that contains all the sql queries from your instance of GrowthBook. We have a Databricks notebook that runs each morning to run various tests on the sql queries of each metric.
We can check:
- Table names are available in the data warehouse
- Tables have been updated with the latest data
- SQL errors in the metric definitions
In the event of an issue slack notifications are sent to our #growthbook slack channel for any of the analysts to pick up and fix.

At Typeform we’re actually self-hosting so have all of this available in a MongoDB which updates automatically when you add a metric through the UI. If you’re not self-hosting then you’ll have to manually download the config.yml.
Conclusions
GrowthBook has allowed us at Typeform to create an experimentation platform that is user friendly, robust, and reliable. In this article I’ve run through my (current) top tips for getting the most out of the functionality that GrowthBook has to offer.
The author has no affiliation to GrowthBook and is simply an avid fan of the product!
How to get the Most out of GrowthBook was originally published in Towards Data Science on Medium, where people are continuing the conversation by highlighting and responding to this story.
from Towards Data Science - Medium https://ift.tt/NyeRC9O
via RiYo Analytics


ليست هناك تعليقات