https://ift.tt/r8UJxFk An Unsupervised Learning Approach Photo by Luisa Brimble on unsplash . We collect books over time and, at some ...
An Unsupervised Learning Approach

We collect books over time and, at some point, may decide to organize them. Color-blocking bookshelves are a trend to arrange books based on color similarity¹. A popular way to organize bookshelves is to create a rainbow effect. This creates a pleasing visual arrangement. Based on the number of books, this may be an easy or a hard task.
Can we arrange books automatically? I wanted to explore machine learning techniques to sort books and compare their results. In this article, I apply unsupervised machine learning methods to sort books by color. Each algorithm uses an objective function to sort colors. Based on the type of algorithm, we will get different results. I experimented with popular unsupervised algorithms to sort colors, which include:
- Principal Component Analysis
- Kernel Principal Component Analysis
- Random Projections
- Nearest Neighbor
- Self-Organizing Maps
I will first go over the dataset preparation and then explore different unsupervised algorithms.
Dataset & Features
Our task is to arrange books based on their images. Image pixels are not informative features. As most books have few colors, reducing the color distribution in a book image to a single RGB value works well. The booklist covers a wide distribution of colors. I created a color palette dataset with the dominant RGB value to represent each book from my book list. The final dataset has a dimension of 99 × 3, denoting the number of books by the number of color features. A randomly sorted color of this dataset is shown below.

Next, I explore different methods to map the data from RGB space to one-dimensional space.
Dimensionality Reduction

Dimensionality reduction algorithms reduce dimension while retaining information present in the high-dimensional data. What makes each method unique is the type of information it preserves in the lower dimension. We want our colors arranged such that similar colors are mapped close to each other. We map the RGB data to a one-dimensional array and sort it. Different methods use different objective functions to reduce dimensions.
In the dimensionality reduction methods, we first learn a projection matrix with a lower dimension, d × m where m < d. Then map our N × d dimensional data onto the projection matrix to get the low-dimensional data N × m. I used the scikit-learn python library to implement dimensionality reduction methods.
Principal Component Analysis
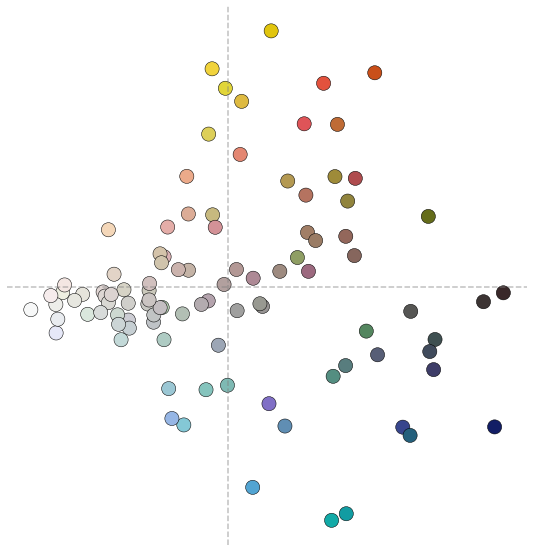
Principal Component Analysis (PCA) maps data onto a low-dimensional subspace that maximizes variance or data spread. The low-dimensional subspace contains eigenvectors of the sample covariance matrix called principal components. As PCA reduces RGB data to a single dimension, it can be used to sort colors². I applied PCA to the color palette dataset. For visualization, we map the RGB data onto the first and second principal components.

Similar color groups clustered together. There is a color trend from lighter to darker shades (left to right). We map the features onto the first principal component and sort the projections.

There is a clear color brightness trend going from lighter to darker colors, but with no intra-color cluster arrangement.
Kernel Principal Component Analysis
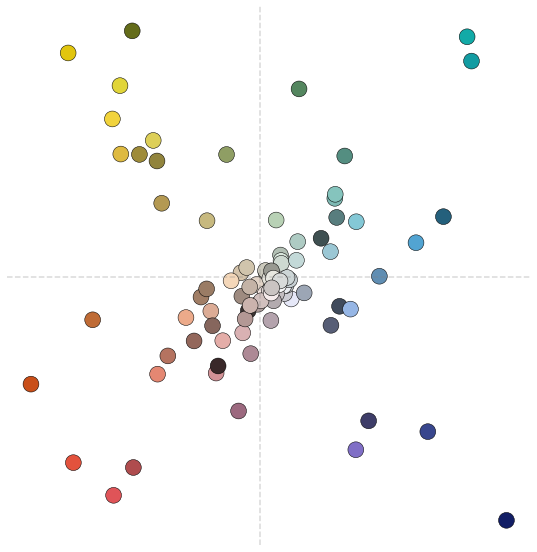
High-dimensional data can have a nonlinear data structure that cannot be learned with linear PCA. The non-linear extension of PCA is the kernel version, where we map the data using a kernel function before extracting the principal components. The kernel function computes similarities between data points. Different kernel functions capture different types of similarities. Based on our data, we have to experiment with different kernel functions. I used a cosine kernel as it provided a good sorting result.

In the above two-dimensional visualization, we see nice intra-clusters of colors. We also see shades of different colors clustering together towards the center. After mapping our data on the leading principal component and sorting, we see the color trend from warm colors changing to lighter gray shades and towards cool colors.

Random Projections
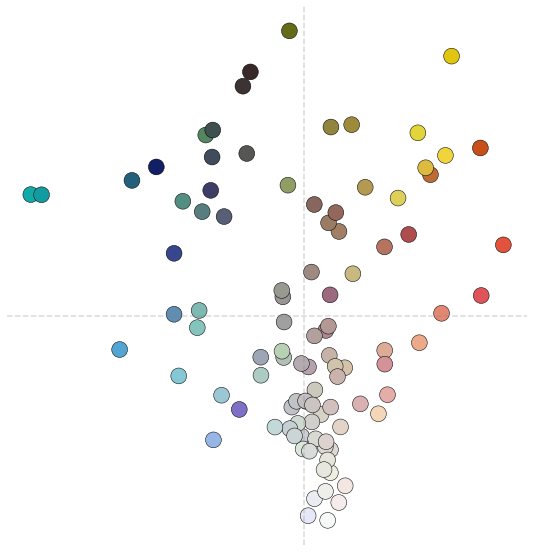
In PCA and kernel PCA, we learn data-dependent projections. When data has very high dimensionality, we run into memory issues with eigenvalue decomposition or covariance matrix construction. Random projections are data-independent projections. When we map data on these projections, the pairwise distances are preserved up to a factor. We construct the projection matrix with smaller dimensions by sampling vectors from a Gaussian distribution with zero mean and variance scaled by the number of dimensions, m. Our final result will change every time, as the sampling is random.

Random projections work surprisingly well. The color bands transition from cool blue tones to light pink shades in the center and towards warmer colors.

While kernel PCA and random projections learn mappings that separate both warm and cool colors, it is interesting to see how the transition is different for both methods.
Next, I explore how to use optimization approaches to sort colors by reframing color sorting as a cost-minimization problem. In contrast to dimension reduction methods, optimization approaches use the RGB data without reducing dimensions.
Travelling Salesman Problem

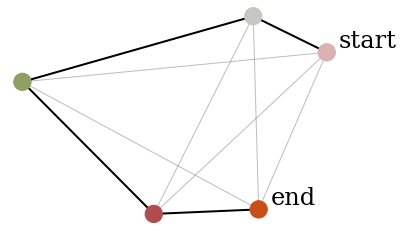
The goal of the traveling salesman problem is to find the shortest distance route for a given list of cities such that all the cities are visited only once. We can reframe color sorting as a traveling salesman optimization problem. In our color sorting problem, we can replace cities with colors³. A toy illustration of the shortest path between five RGB values based on Euclidean distance given a starting node is shown above.
Nearest Neighbor
A heuristic to solve the traveling salesman problem is to use the nearest neighbor method. Given a two-dimensional distance similarity matrix, we start with a random color and iteratively find the nearest color cluster. Based on the distance metric used, the results will vary. This method creates a rainbow-like effect. I used the Euclidean metric to create the distance similarity matrix.

Self-Organizing Map
A self-organizing map (SOM) is an artificial neural network that learns a two-dimensional map of the data through competitive learning. SOM aids with data visualization and clustering. We learn a two-dimensional map of the N × d dimensional data where the data is clustered based on similarity. Similar colors are close to each other than dissimilar colors.

Compared to the dimensionality reduction methods, SOM creates better intra-color clusters. I used the MiniSom python library to implement SOM.
Conclusion
To summarize, all the above methods group the colors differently. In PCA, only brightness information is considered important. Compared to PCA, other dimensionality reduction methods maintain intra-color grouping, whereas SOM and Nearest Neighbor methods create a rainbow-like color arrangement.
References
[1] Jura Koncius, Organizing books by color: Which camp are you in?
[2] Cameron Davidson-Pilon, Using PCA to sort high dimensional objects
[3] Alan Zucconi, The incredibly challenging task of sorting colors
All images, unless otherwise noted, are by the author.
Visual Sorting with Machine Learning was originally published in Towards Data Science on Medium, where people are continuing the conversation by highlighting and responding to this story.
from Towards Data Science - Medium https://ift.tt/xesVOkL
via RiYo Analytics

No comments