https://ift.tt/Rqs8vQU Understanding the model’s output plays a major role in business-driven projects, and Sobol can help Photo by Marti...
Understanding the model’s output plays a major role in business-driven projects, and Sobol can help

Introduction
Every data projects include naturally an initial stage of pre-processing to get:
- Data in an appropriate format allowing the next stages of the project to function properly.
- High-quality data to ensure the best performance.
This second point includes two well-known steps from Data Scientists: feature selection and feature engineering.
- Feature Selection is the process of discarding relatively “unimportant” variables while minimizing the loss of information.
- Feature Engineering is the process of creating new variables from existing ones that are intuitively or “statistically” significant. Usually, transformations or interactions of variables are performed.
Nevertheless, to perform these steps, a key issue appears: how to measure the importance of a variable?
In this article, I will present a little-known method that answer this question: the Sobol Index
Measuring importance
The objective is to rank the impact of each input on the output. The thesis [2] suggests that the importance of a variable relies on its distribution via two factors:
- Its weight: its distribution can increase or decrease its importance. Let’s say we are studying the importance of gender and other factors in the probability of dying on the Titanic: in a female population, we would expect gender to predominate, whereas, with men, another factor might be more important.
- Interactions: the distribution of the variable can be influenced by the variation in the distribution of another variable
Commonly, 3 methods exist to measure variables’ importance:
- Approximate the model by linear regression and analyze the weights via their p-value
- Perform more advanced statistical tests (chi2, t student, fisher, ANOVA …)
- Functional decomposition
The Sobol Index is based especially on the latter — functional decomposition — applied to the variance.
The Sobol Indices
Intuition
The importance of an input variable X_i is measured by the part of the variance of Y for which it is responsible, that is, if we fix X_i, we look at how much the variance (of Y) has decreased. If it has dropped significantly, then the variable X_i was measuring a large part of the variance of Y and therefore X_i is an important variable. Therefore, the uncertainty of Y is attributed to the uncertainty of X_i since it represents mainly its variance.
1st Order
There are different orders for the Sobol Index reflecting the number of variables interacting with each other. Therefore, the 1st-order quantifies the share of variance in Y due to the only variable X_i. If there are p variables, there will be p 1st-order indices. Mathematically, the relation is the following:
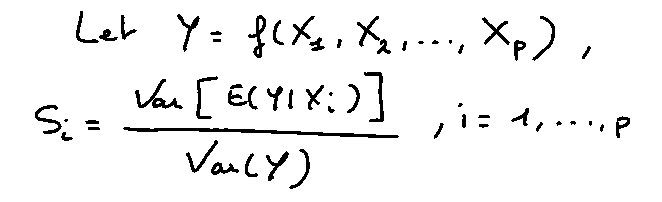
The expectation 𝔼(Y|X_i) is the average of Y where only the values of X_i are conditioned (fixed).
The division by the total variance V(Y) eases the interpretation of the result: the closer the index is to 1, the more important the variable (if order 1) or the group of variables (order > 1) is.
The index of order k makes k variables interact with each other X_i1, X_i2, …, and X_ik by fixing their values in the same way as for the 1st order. The purpose of the next part is to describe as simply as possible the path to get to the generalized formula (for every order).
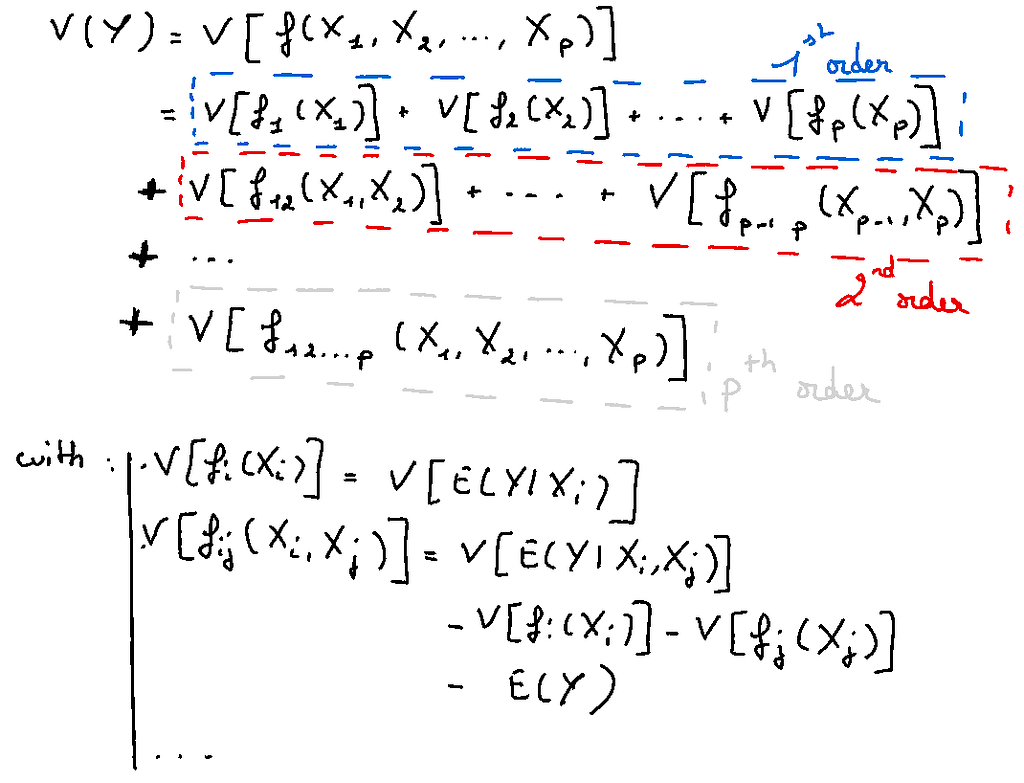
General Form
The starting point is the functional decomposition of ANOVA. Adding other assumptions (e.g. orthogonality) to this theorem, Sobol demonstrated that this decomposition is unique. He integrated the variance in the theorem and obtained the following equality:
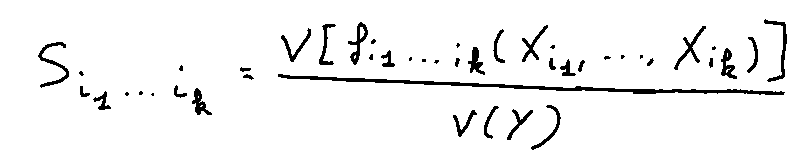
Finally, the formal definition of the Sobol Index of order k is:
The drawback of this method is its algorithmic cost. Indeed, there are “p choose 1” 1st-order indices, there are “p choose 2” 2nd-order indices or p*(p-1)/2 indices, …, and there is only one index of order p. To sum up, there are 2^p — 1 index. This exponential complexity makes it difficult to study sensitivity in high dimensions.
Fortunately, Homma and Saltelli have found a way to get around this problem: compute the total index of a variable. This index sums up all the indices where the variable of interest is present. For example with 3 variables, S_T1 = S_1 + S_12 + S_13 + S_123.
They established the following relation:
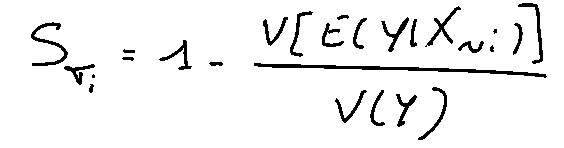
The term V(𝔼(Y|X~i)) is the 1st-order effect of X~i, i.e. this term is the variance of the expectation of Y conditioning on all variables except those of X_i considered.
If we subtract the total by the 1st-order index, we have access to the sum of the indices greater than 1 for a specific variable. Of course, we do not have the exact values of each order, but this allows us to have a sense of the set of values of the higher orders.
In Practice
In reality, the calculation is impossible directly. Thus, we use estimators and in particular, the Monte-Carlo Method.
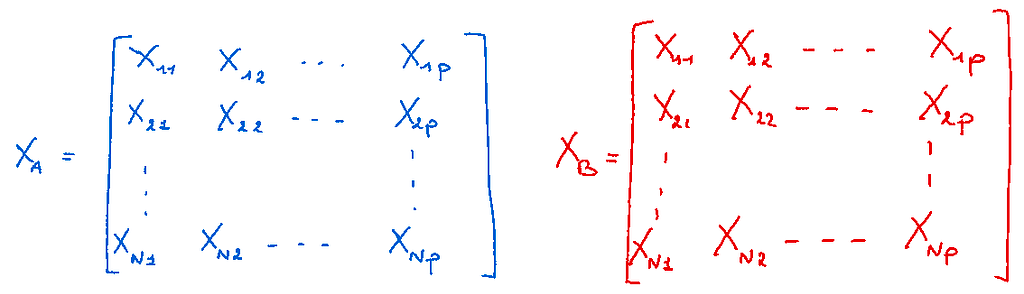
The latter is based on two samples of N examples from the original dataset such that two different matrices are used, like this:
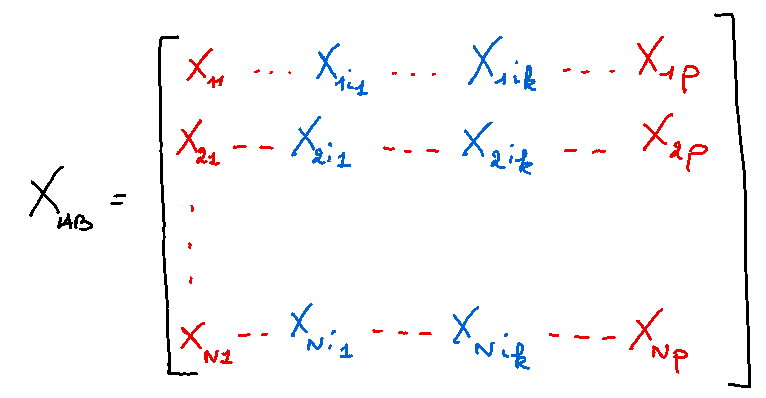
If i1, … ik are the k variables of the index we are interested in, we define a 3rd matrix equal to B but with the values of A for k variables such that:
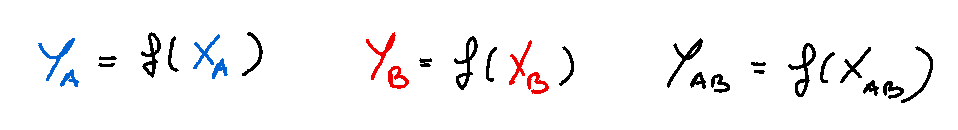
The 3 outputs are written as follows:
For the 1st-order, the method of Sobol consists in rewriting the equality like this:
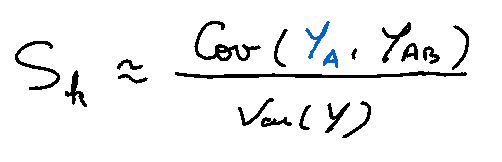
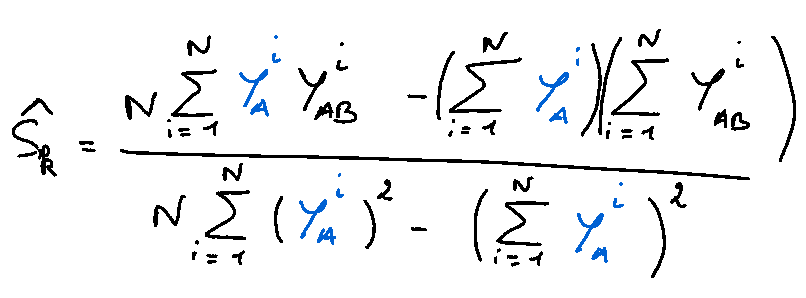
Each quantity can be therefore estimated to get the 1st-order index of the k-th variable:
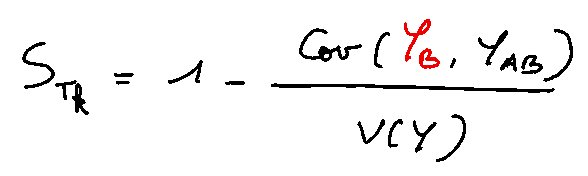
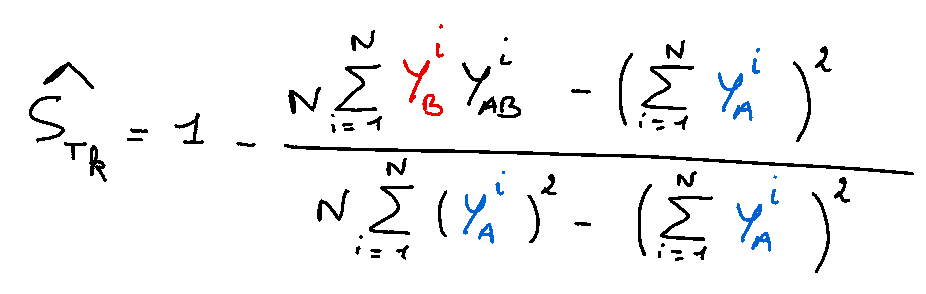
In the same way, the total index was rewritten:
which leads to the following estimator:
By definition, S_Tk is larger than S_k since it incorporates both the main effect and all interactions of the input variable X_k.
Now, let’s apply this method to a toy example!
Application
I will use a dataset that gives the number of bikes rented per hour in Seoul according to some weather variables (temperature, rain (mm), visibility …) and also other variables as shown in the table below.
The pre-processing stage will be omitted since the topic is the index. However, a step must be mentioned: the need to normalize the data between 0 and 1. Indeed, the ANOVA functional decomposition relies on a strong assumption: the domain of definition of the function must be between 0 and 1 to have a unique decomposition (necessary condition).
The code can be divided into 3 blocks.
Block 1
After cleaning the data, I implement 3 functions that respectively create matrix A, matrix B, and matrix AB. Here is the code:
Block 2
Then, I create the main function that will calculate, for a specific variable, its 1st-order and total effect, such that:
Block 3
Finally, I show a simple function to plot a stacked bar to represent easily, for each variable, the effect of its 1st order and the total:
Results
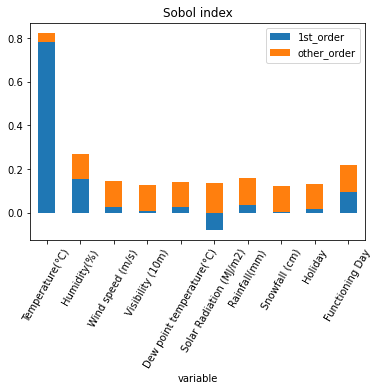
After several tests and different data, I noticed that the estimators are not efficient for a number of examples N < 1000. From 5000 onwards, I started to get decent results as above.
The Sobol indices provide results from another perspective:
- Temperature plays a predominant role in the number of rented bicycles per hour since almost 80% of the variance of Y seems to be estimated by it.
- For all variables except temperature, the Sobol indices due to interactions predominate over the 1st-order. That is, taking alone, these variables do not contribute mainly to the outputs, but this is their interactions with others that make the variable more significant.
- It is important to note that, without the mention of the standard deviation, the analysis of the values remains statistically poor. For example, we see that the variable “Dew Point Temperature” has a negative 1st-order, which is theoretically impossible. If we had the standard deviation and the p-value, we might see that this variable is probably not significant for the model.
Conclusion
In a project, this method can be used to support other more traditional methods of measuring variable importance (linear regression, statistical tests). Moreover, the explanation may be difficult for a non-scientific audience (notions of variance, interaction …). However, its simplicity of calculation through estimators and statistical efficiency may appeal to scientists who want another method of measuring the importance of their independent variables.
Note: Every handmade figures are all made by me.
Sources
- [1] https://artowen.su.domains/pubtalks/siamUQ.pdf (for a deep mathematical explanation of the Sobol Indices)
- [2] https://foundation.scor.com/sites/default/files/2022-01/Silvia_Bucci_Memoire_ia-light.pdf (a french thesis interesting that mentioned the Sobol Indices)
Sobol Indices to Measure Feature Importance was originally published in Towards Data Science on Medium, where people are continuing the conversation by highlighting and responding to this story.
from Towards Data Science - Medium https://ift.tt/FZxRYJq
via RiYo Analytics


No comments