https://ift.tt/twIzWUq Data-Driven Decision Making often provides a perfect answer to the “Wrong Question”. Photo by Claudio Schwarz on ...
Data-Driven Decision Making often provides a perfect answer to the “Wrong Question”.

Nowadays, it is hard to find any firm that does not put “Data-Driven Decisions Making” (DDDM in short) on the top of their strategy list. Companies have more data than ever, and their natural incentive is to find out how they can create value out of this data. However, according to the report¹ (survey of 190 executives across various industries in the U.S.):
Only 32% of companies reported being able to realize tangible and measurable value from data.
Here, I would like to offer an insight that may explain why companies can not achieve the value from the data. It is important to recognize that, in DDDM, the focus point is the data. We hear a lot in CEO talks, company presentations, medium articles :), etc., phrases like “Data has a better idea” or “Data is the new gold”. The main idea of “Data-Driven Decisions Making” boils down to:
What Insight can we extract from the data?
I want to tell you that following the above question often leads to asking “Wrong Questions”. In the DDDM approach, we try to find a purpose for the data at hand. However, that is not the goal of decision-makers. The goal of decision-makers in companies is to create value, which only comes through “High-Quality” decisions. In organizations, we need to find the relevant data that serves a purpose for the decisions.
The only way organizations can create value is through making high-quality decisions, and the data needs to serve to achieve that purpose.
With this background, I would like to go through an example of a business decision, where first I consider the case of the “Data-Driven” approach. It will follow with another alternative to fix some flaws in the approach through the “Decision-Driven Data Analytics” approach.
Example of Business Decision:
Churn Analytics:
For any SaaS (Software as a service company) which serves a product to its customer, churn analytics plays an important role. To put it simply, churn analytics involves building a :
A predictive churn model that looks at the user activity from the past and based on customer features then creates a model that gives the probability of costumer is ending your service or product.
We as customers all may churn from a particular service through the²:
- Ending the subscription
- Closing the service account
- Refuse to renew a contract or service agreement
And the SaaS company needs to find solutions to reduce the churn rate, as³
Acquiring a new customer is 6–7 times more costly than retaining an old customer.
Given this brief description of the case, we follow the DDDM approach to decide for this problem:
Data-Driven Approach:
Now, let’s go through one example of developing a machine learning (ML) model that can give us the probability the customer will leave the subscription (churn probability). The ML model is based on the in-house data of the company. This ML model will then be used to “Decide” for which customer a Gift card (10$) is sent when the subscription of the person ends (to renew the subscription, the company has an annual fee of 100$). For example, below is the past user data of an “Online Shopping Website.” The user named “David” (26 years old) has had his last purchase 19 days ago and has had a login to his account once during the previous month.
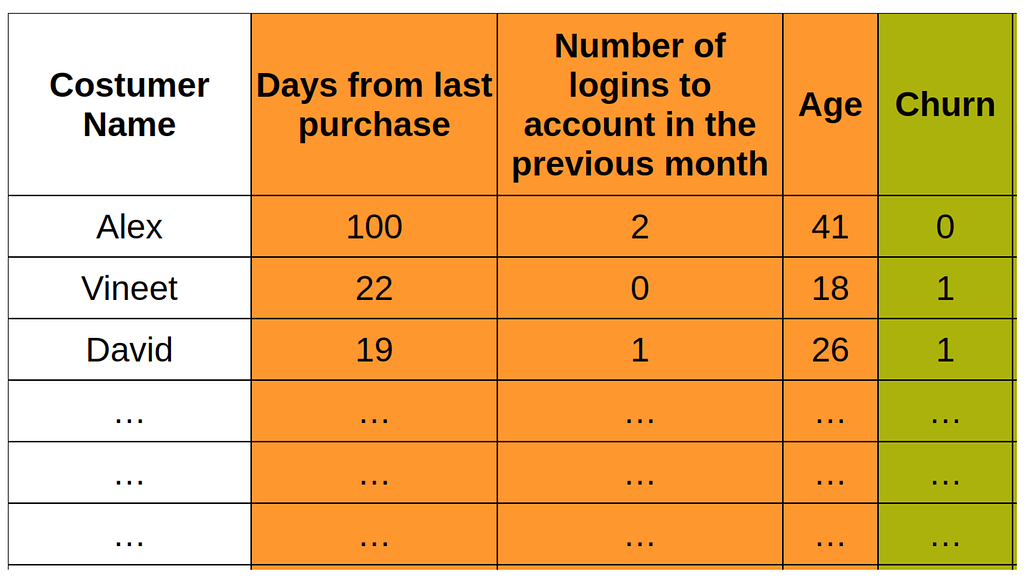
In the above table, we see the “Data” of the past customers, where the column name “Churn” says whether they churned (stopped the subscription) the service (subscription here) (Churn=1) or did not (Churn=0).
Now, given this data, we can build a machine learning model that says, for any person in the future (unseen data), what probability will the person churn?
To put it from a simple ML perspective,
X: Column of features (Orange columns)
Y: Column of output (Green column)
Having built a “Predictive Model”, now imagine the “Online Shopping Website” needs to decide for three customers that their subscription end soon, send a gift card to avoid “Churn” of the person. (They can send a 10$ Gift card only for one person).
Now the decision to make is:
Among three customers (James, Mohammad, and Helen) ending their subscription soon, which one do we need to send “Gift Card”, to reduce the churn rate?
We use our ML model to make this decision, apply it to three customers, and ask ML to predict, “What is the probability the person will churn”?
In the below table, you see the ML model predicted that James has an 80% probability of ending the subscription, Mohammad 60%, and Helen 40%.
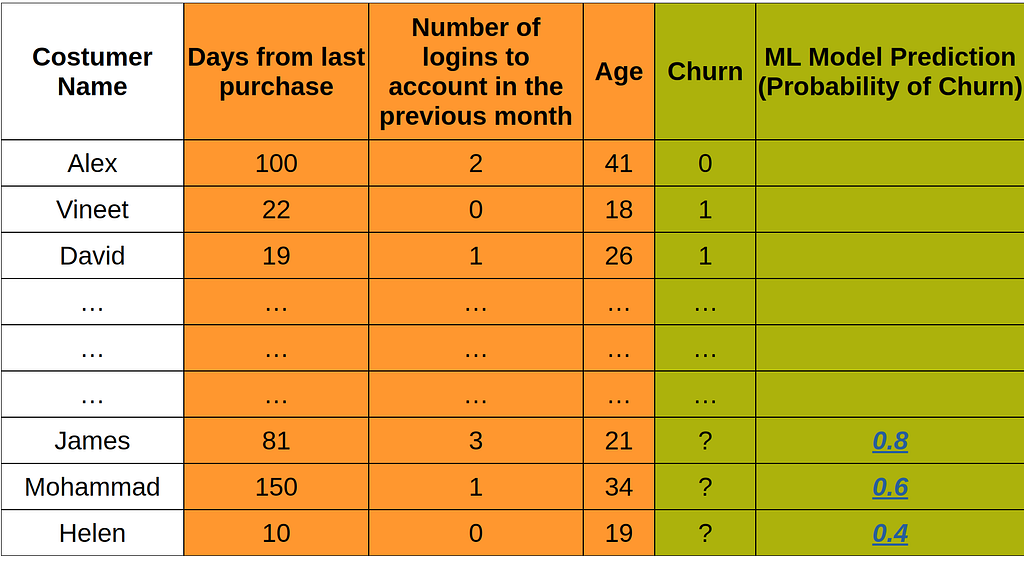
Given the prediction of the ML model, it can be justifiable that the “Gift Card” needs to be sent to James, as he is the customer with the biggest probability of leaving the subscription. I think this will be a logical decision to make, as we try to send the “Gift Card” to the person with the highest risk of leaving the subscription.
However, as I will outline below, the above approach has some flaws (though looks rational) and leads to making a “suboptimal” decision.
Decision-Driven Approach:
Here, in this section, I want to reframe the same business problem by bringing the “decision” in hand first and then gathering the data. In this approach, the “Decision” comes first, and the relevant “Data” to support the best decision comes afterward.
As a classic decision analysis exercise, for any “decision” making process, we need three elements (at least), in this case:
- Alternatives:
Here the choices are whether to send a 10$ Gift card to James, Mohammad, or Helen (three alternatives).
- Objective
The objective is to maximize the value for the organization (here, given the cost of a 10$ gift card and a return of 100$ for continuing subscription)
- Information
We need the information to assign the probability of whether our customer will end a subscription or continue. Given these three elements, the “Decision Tree” of the problem at hand can be drawn as below:
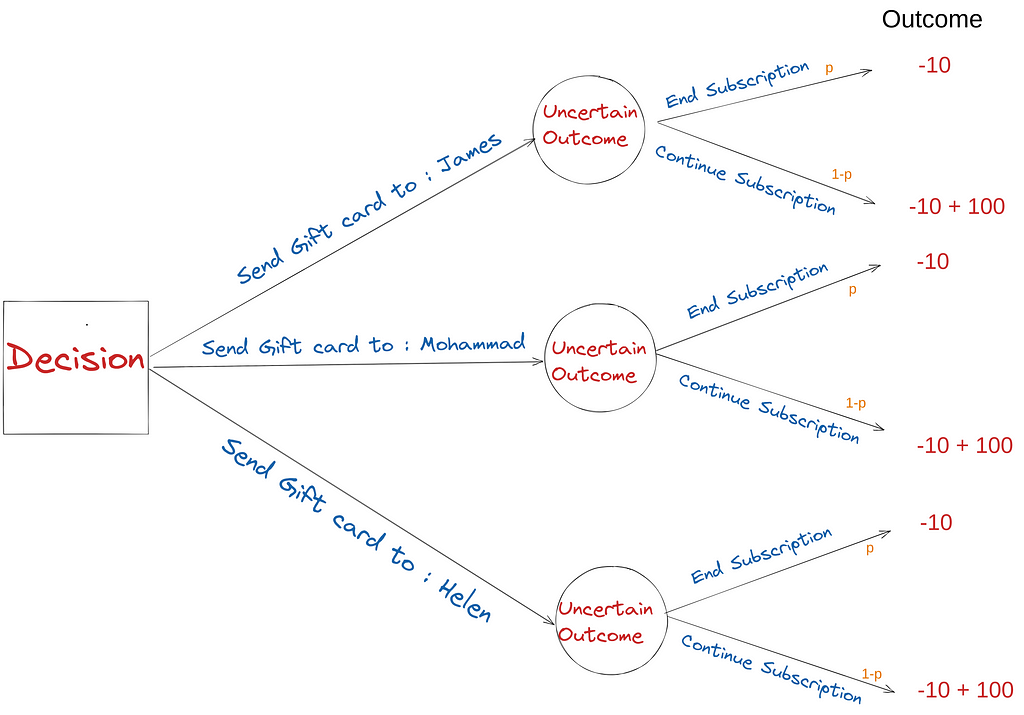
Given alternatives, objectives, and information, the above decision tree is a starting point for framing the decision context. The Decision-driven framework asks for the relevant data needed for high-quality decisions. In this case, the relevant data is:
What is the customer’s probability of ending the subscription, given she is offered the 10$ Gift card?
Worth to mention that, The information we need in the Decision-Driven approach is different from the one in the Data-Driven approach. In the Decision-Driven approach, the right data for this problem will be the information that gives estimates of the “p” in the above decision tree.
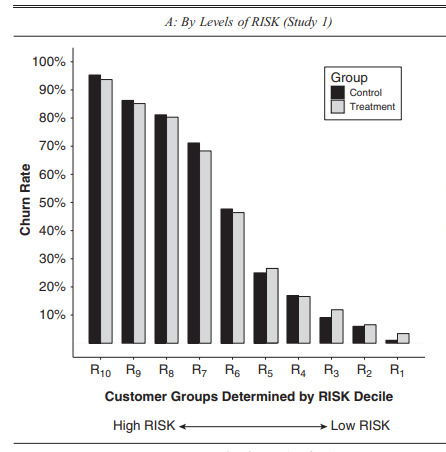
Organizations can acquire such information through experimentation, like the A/B tests. What you can do is have 100 number of customer and randomly give half of them the gift card (treatment)and the other without andy gift card (control) and compare the “effect” of the decision. In the chart below, I am showing the figure of a “great” research paper that addresses this analysis. The x-axis shows the customer with the “highest” risk of leaving the subscription (R10) toward the least (R1). In our case, we can assume James belongs to a group of R8, Mohammad to R4, and Helen to R2.
Surprisingly, we can see that according to the study, the probability of ending a subscription is almost equal to the probability of ending a subscription given by giving a gift card in a renewal letter:
P(End Subscription) ≈ P(End Subscription|Receiving Gift Card)
Having this information, now we can write down the decision tree, this time with the probability found from the above analysis.
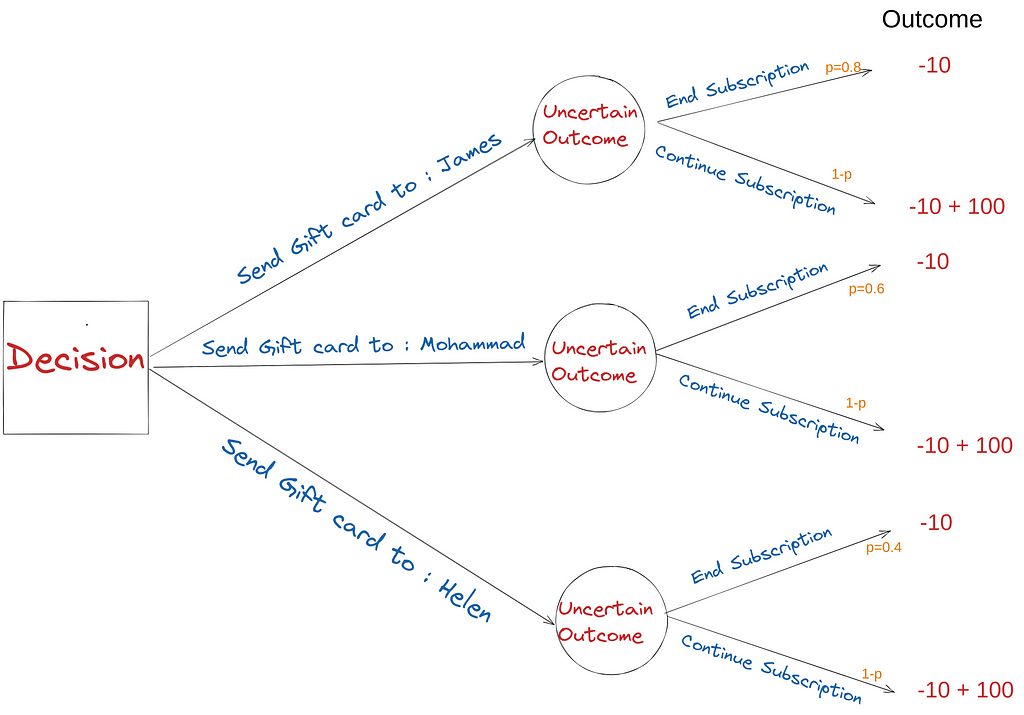
Now, having the alternative defined, the information that provides an assessment of the uncertainty and objective, we can make a decision based on the “Expected Outcome” of each choice:
Alternative 1) Send a Gift card to James:
EV = 0.8×(-10) + 0.2×(90) = 10
Alternative 2) Send a Gift card to Mohammad:
EV = 0.6×(-10) + 0.4×(90) = 30
Alternative 3) Send a Gift card to Helen:
EV = 0.2×(-10) + 0.8×(90) = 54
If we follow the “Decision-Driven” approach, the gift card should be sent to Helen, whereas in the “Data-Driven” approach, the person was James. So What changed that we ended up having two different actions to make, depending on the approach,
The Data-Driven approach provides a perfect answer to the Wrong Question. Decision -Driven Approach starts with a “Right Question” and tries to utilize the relevant data to answer the question.
Take-Aways Messages:
- The goal of the decision-maker in the enterprise, consultant providing service to a client a, and employees who make operational decisions are to create value, and the value only comes through “High-Quality” decisions.
- To make the “High-Quality” decisions, we need first to frame the decision and recognize its elements (alternatives, objective, and uncertainty) and make decisions based on the choice with the highest expected reward.
- The “Decision-Driven” approach provides a framework for making “High-Quality” decisions. “Data-Driven” decision-making can lead to a suboptimal decision by finding the purpose for the data rather than fitting the data to the purpose.
Final Note:
I would like to add that I learned a lot from reading this article. For a deeper study of the field of Decision analysis, this book is the one you will need. Also, you can follow Cassie Kozyrkov (Cassie Kozyrkov) to learn more about “Decision Intelligence.”
[1] “Closing the Data Value Gap,” white paper, Accenture, Dublin, 2019.
[2] Machine Learning Powered Churn Analysis for Modern Day Business Leaders
[2] Ali Cudby, CEO of Your Iconic Brand: https://tinyurl.com/bdh9uy2z
The Downside of Data-Driven Decision Making was originally published in Towards Data Science on Medium, where people are continuing the conversation by highlighting and responding to this story.
from Towards Data Science - Medium https://ift.tt/DCM7tl9
via RiYo Analytics

ليست هناك تعليقات