https://ift.tt/GE5pX17 How can Data Scientists benefit from User Story Writing and Mapping from product discovery in our segmentation or mo...
How can Data Scientists benefit from User Story Writing and Mapping from product discovery in our segmentation or modelling?

In the product development world, many techniques are used to prioritize the backlog of new ideas or features to improve the product, bugs to fix or updates needed, among others. Some of those techniques are used to manage the team sprints, but others can also be useful for feature engineering. In this case, I want to show you how I have developed behavioural segmentation using User Story Writing and Mapping. But let’s start from the beginning.
What is User Story Mapping?
User Story Mapping is technique used in product discovery: outlining a new product or a new feature for an existing product. It consists on a visual exercise that help product managers and their development teams to define the work that will improve the user experience.
The result helps to keep an eye on the big product picture while also providing all the details.
At the time of the development of the segmentation, our data science team had the business problem to divide customers based on the intention they had in the platform. But how to start?
For an e-commerce company that tracks hundreds of frontend events, choosing the most important is critical. We can obviously use the traditional approach of:
- Data discovery
- Data preparation and feature creation
- Model development and evaluation
- Error analysis
- Repeat from the beginning to beat the performance
But we can also speed up the process using User Story Writing, where we can focus on the functionality and the value of a user’s perspective.
A user story would be:
As a …. (persona) I want to … (function) in order to … (reason / user wish)
Now let’s translate to our behavioural segmentation. Imagine we are in a food-delivery industry and we want to create segmentation for customers that have different intentions when they come to order the food:

We see two scenarios here with the same goal: order food. But how can we get the best features to explain each behaviour?
As data scientists, some teams have more experience than others in how the tracking system works in their companies, also it can be difficult to understand all the features available. In my case, to avoid problems and to make sure I could get the best out of the User Story for my segmentation, I also included Story Mapping.
The Process
Firstly, I developed all my User Stories (as in the picture above) and provided enough context in the text so it could be mapped to our user journey on the platform.
Secondly, I gathered in the same room a group of experts on frontend tracking in the company: product analysts. They work continuously with the squads to improve the tracking, to create the best product reports and dashboards where the product managers can find gaps or opportunities to improve the product/feature or just see how their last release is performing with an AB-test.
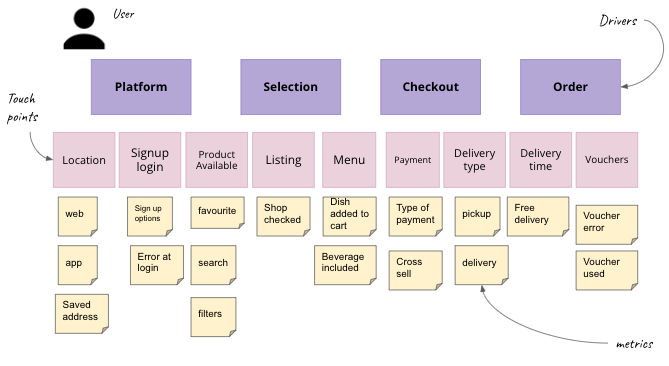
After having my stories and people, we defined the main steps of the user journey for our product. Example:

Next, we included the necessary touchpoints a user should follow in order to complete the main drivers. For example, restaurant discovery contains home, add location, registration, list of all restaurants available, search, filters, etc. or like in the picture below, the platform contains location and signup.

Depending on how many User Stories we have, make the same subgroups of the experts and assign each group to one User Story. Their goal is to:
Identify the metrics necessary to map your story to your data
Once all the metrics are written down under each of the touchpoints(such as the metrics in the user story mapping example), then they have to prioritize each task within each flow step column. The idea is to select later the “minimum number of events” that we need in order to explain the user behaviour. Some groups could have more tasks than others, but that’s fine.
The exercise will end by gathering all the events from the minimum value items from the different groups. With the new list, the data scientists can start discovering the data and creating features from it that will speed up the feature selection part for the segmentation.
It could be that during the discovery part, some of the data is not eligible to be used due to poor quality, too many missing values or any other issue. But don’t worry, remember that the tasks were prioritized in our mapping, so if there are not enough features, some can be taken from the respective columns after the Minimum Value selection.
This can also be applied for any model we want to develop to speed up our feature selection knowledge.
Recap:
- Define the different scenarios to cover
- Make groups of experts so they can cover each scenario
- Over the user journey in our application, map each user behaviour to the events or data
- Prioritize per step and select the minimum events needed to explain the user behaviour
- Combine all the events for the data scientists to use as features for the segmentation or modelling
I hope you find it interesting, please post any comments or questions you may have, I’m more than happy to help you and advise based on my experience. Feel free to follow me on medium or LinkedIn to connect.
How Data Scientists can benefit from User Story Mapping for Segmentation Projects was originally published in Towards Data Science on Medium, where people are continuing the conversation by highlighting and responding to this story.
from Towards Data Science - Medium https://ift.tt/NId8irK
via RiYo Analytics

ليست هناك تعليقات