https://ift.tt/nmH6QwS Nothing deflates an A/B testing program quicker than data validation issues — and SRM is one of the most damaging. B...
Nothing deflates an A/B testing program quicker than data validation issues — and SRM is one of the most damaging. But how accurate is testing for SRM anyway?

Suppose you have an A/B test where you expected a 50/50 split of users in each test group. Instead, the Control and Variation groups are off by around 7%. You have a total of 8,000 users assigned to the experiment.
Should we stop the test? I mean, how sure are we that a problem exists? We can use the Chi Test I described in a previous article. If the Chi Test is negative, we might ask: Is seeing such a large difference normal? If the Chi Test is positive, we’d ask: what are the chances it’s a false positive?
Stopping tests is very disruptive and we’d prefer not to do that unnecessarily. We need to be certain we’re making the right call.
Additional questions I often get asked: what does this risk of a false positive (Type I error) look like? Also, what traffic volume is optimal to conduct an SRM check with a high degree of accuracy?
These questions can probably be answered using straight-up math and normal distribution curves etc. but I thought it would be fun to use simulations instead. Simulations provide us with actual experiment data that we can interrogate and explore. I find it easier to explain stuff using simulation data.
My goal is to simulate various loads of traffic landing on a webpage and getting assigned and counted into an experiment. This means the traffic will be randomly assigned to two buckets: A and B. Since we’re not expecting any difference between the two groups, we can consider these as A/A experiments and use them to explore what could happen through random chance.
This should hopefully help us answer some of the questions I posed earlier. There’s a bonus question at the end that I’ll also explore: does continuous checking for SRM
I’ll be using Python. So, feel free to follow along in a Jupyter Notebook or similar to nerd out with me (or to peer review my findings). If you’re not interested in the code and trust me completely (what’s wrong with you), then you can either skip to Step 5, or go straight to my Conclusion at the end of the article to review my findings and conclusions.
Stage 1: Simulating random assignments
My first task is to simulate the way testing tools randomly split traffic between two test groups. Here’s our function:
from random import randint
def traffic_sim(traffic):
    a,b =0,0
    for x in range(traffic):
        if randint(0,1) == 0:
            a +=1
        else:
            b += 1
    return (a,b)
The traffic parameter is the total traffic I want split between two groups (A and B). I use randint(0,1) to get a random boolean (0 or 1). I use this to assign my imaginary users to my two test groups. This is kind of like a digital version of a coin toss.
The output from this function is a tuple (a list with two values). One number for A, and another for B.
Let’s run this with 100 example users.
traffic_sim(100)
My output is this:
(55, 45)
So, we have 55 users in A, and 45 users in B. We were expecting 50/50. But this is what we got. Not too bad.
Obviously, this traffic is super low. But it’s a good way to test this function. I’ll come back to this later with higher volumes. For now, I’m curious to see if my first example (55, 45) validates when using Chi.
Step 2: The SRM check using Chi
I won’t explain this function in much detail here, as you can read my previously mentioned article on this (this is the last time I link to the article, honest).
Below is the function.
from scipy.stats import chisquare
def srm_check(tup):
    diff = max(tup) - min(tup)
    total_traffic = (sum(tup))
    expected = sum(tup)/2
    perc_diff = (diff/(sum(tup)/2))*100
    chi = chisquare(tup, f_exp=expected)
    srm = False
    if chi[1] < 0.01:
        srm = True
    return ({"srm":srm, 'diff':perc_diff})
I pass in a tuple of values (tup)which represents my A and B traffic assignments, and get returned a dictionary with a True or False for SRM. I also get the percentage difference between the groups. If I pass in my tuple of (55, 45), I get this:
{'srm': False, 'diff': 20.0}
So, even though the difference is 20%, the SRM check is False. Makes sense. With such low volume, the chances of seeing 20% is within the expected random chance.
This is good. But, again, this is low traffic. Relax. We’ll be passing through larger volumes later.
Step 3: Define a number of samples
Running the SRM for a single simulated test is too restrictive. I want to simulate thousands of tests to get a better understanding of risks. I want a function that returns me n number of possible splits I could see.
Here’s my function:
def get_samples(traffic, samples):
    list_results = []
    for x in range(samples):
        list_results.append( srm_check( traffic_sim(traffic) ) )
    newlist = sorted(list_results, key=lambda d: d['diff'])
    return newlist
This function expects traffic and samples parameters.
- traffic — the total traffic volume we want to use. We’ve been using 100 up to this point
- samples — how many simulated samples do we want to generate. We’ve only been working with 1 up to this point
The function runs my traffic simulation and SRM functions for the number of samples I’m after. I’ve made bold the calls to my other functions.
What I get returned is a list of test results, each detailing whether SRM is true or false. The results are ordered in ascending order of difference (smallest difference to largest difference).
Let’s run this function to get 10 experiment results, with 100 users assigned to each experiment.
get_samples( traffic=100, samples= 10 )
I get this:
[{'srm': False, 'diff': 0.0},
 {'srm': False, 'diff': 4.0},
 {'srm': False, 'diff': 8.0},
 {'srm': False, 'diff': 8.0},
 {'srm': False, 'diff': 12.0},
 {'srm': False, 'diff': 12.0},
 {'srm': False, 'diff': 16.0},
 {'srm': False, 'diff': 20.0},
 {'srm': False, 'diff': 20.0},
 {'srm': False, 'diff': 36.0}]
For each experiment, I validate whether SRM exists, and I get the % difference between the two groups. If a test validates “True” for SRM, we consider this to be a false positive.
As you can see above, there are no false positives here, even though I see 36% difference for one of them. Ouch.
Note: The reason we see such large differences is because our normal distribution is wide at this volume, meaning it is possible to get a wide variety of results within the probability range we’ve chosen.
Still, this is low traffic. Chill. We’re getting there. Before I push a lot more traffic through, I have a few more functions to make…
Step 4: Get false-positive rates, and more
Reviewing a list of ten experiments is easy. I want to ultimately perform this test with thousands of experiments. And manually checking thousands of tests is a lot of work.
I want to instead create a function to tell me the false positive rate for my experiment samples.
Note: Since we’re using a p-value of < 0.01, we expect this rate to be around 1%. Let’s see if this holds up.
Here’s my function. It takes the list of samples I’ve generated from the srm_check function above and outputs the false-positive rate as a percentage.
def get_false_positive_rate(list_dictionary):
    false_positive = 0
    for item in list_dictionary:
        if item['srm'] == True:
            false_positive += 1
    return ( false_positive / len(list_dictionary) )*100
Next, I want to see what the average difference is between A and B assignments. This will give me an idea of what sort of difference I’m likely to see between my sample experiments:
def get_mean_diff(list_dictionary):
    my_list = []
    for item in list_dictionary:
        my_list.append(item['diff'])
    return (sum(my_list)/len(my_list))
Next, I’m curious what is the maximum difference I can expect between the A/B groups without tripping the SRM alarm? This will give me an idea of what the minimum detectable effect would be for declaring SRM.
At the same time, I want to know what is the maximum difference observed between groups? (SRM would be declared as True in this case.)
This function below can handle both the aforementioned questions. It takes the list of samples and the SRM value we want to use (i.e. True or False). The function returns the highest numbers found in my dataset.
def get_max_diff(list_dictionary, srm_value):
    my_list = [0]
    for item in list_dictionary:
        if item['srm'] == srm_value:
            my_list.append(item['diff'])
    return (max(my_list) )
Next, let’s get a view of the spread of my data and get the standard deviations. This will give me an idea how wide the normal distribution curve is for the experiment samples. The following function will do that:
def get_stdev(list_dictionary):
    my_list = []
    for item in list_dictionary:
        my_list.append(item['diff'])
    return statistics.stdev(my_list)
Lastly, I want to return all of this as a dataframe so I can easily browse the results in a table. This function will do this:
import pandas as pd
def get_dataframe(traffic, samples):
    results = []
    for item in traffic:
        list_dictionary = get_samples (item, samples)
        results.append({
            'Total traffic': item,
            'SRM Type I rate':str(get_false_positive_rate(list_dictionary))+'%',
            'Avg diff (SRM=False)': str(get_mean_diff(list_dictionary))+'%',
            'Standard deviation': get_stdev(list_dictionary),
            'Max diff (SRM=False)': str(get_max_diff(list_dictionary, False))+'%',
            'Max diff (SRM=True)': str(get_max_diff(list_dictionary, True))+'%'
        })
This function is also going to act as my main function. So, I tell this function:
- how much traffic volume I want to simulate as a list*.
- the number of experiments I want to run. The more experiments (or samples) I use, the greater the accuracy I expect to have.
This main function then calls my other functions as necessary to present me with a nice table with my results.
See the full python code here.
*I’m using a list for traffic volume, so I can send through multiple traffic volumes at once.
Great. Let’s see this in action...
Step 5: Evaluate my results
I want to simulate 10,000 experiments and check them for SRM. The experiments will have various amounts of traffic: 1,000, 2,000, 3,000, etc. All the way up to 20,000 total users.
traffic = [1000,2000,3000,4000,5000,
       6000,7000,8000,9000,10000,
       11000,12000,13000,14000,15000,
       16000,17000,18000,19000,200000]
get_dataframe(traffic=traffic, samples=10000)
Careful not to crash your machine with this. This is a hard-core task for a machine to process. Here are my results. Your results may vary slightly, but shouldn’t be too far off:
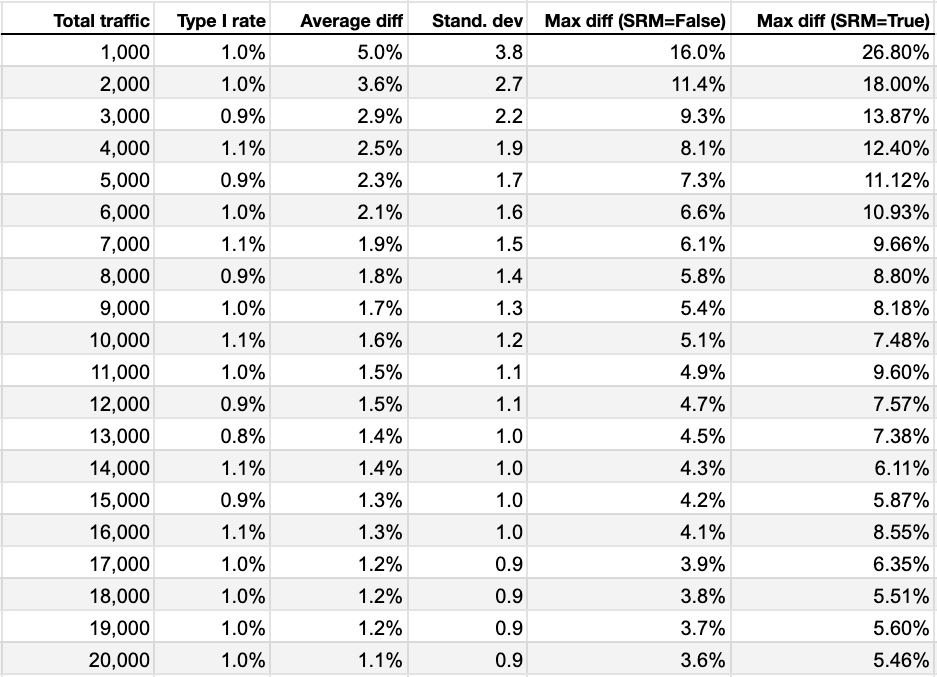
Type I rate is our false-positive rate and it is more or less consistently 1% for all traffic volumes. This was expected because we used a p-value of < 0.01.
Average difference is where things become interesting. Remember that this is the mean difference between our test groups. The closer to zero, the better. At low traffic (1,000 and 2,000) the average difference is large (5.0% and 3.6%). This difference gradually becomes less as we increase traffic.
Standard deviation is where we check the spread of the data. This tells us how variable the differences are for each of our sample experiments under different traffic volume conditions.
Max difference (SRM=False) is the maximum difference between test groups before the SRM alarm trips. Closer to zero is best. We can see that the SRM alert will trigger at higher % differences (16% and 11.4%) while traffic volumes are low (1,000 and 2,000). This gradually reduces over time.
Max difference (SRM=True) is the largest difference observed while randomly assigning users. Our SRM check will trigger positive for these values. We can see very high % differences at low traffic volumes. These numbers are volatile, though. Each time we run the simulations we get very different values, sometimes larger than the ones you see in the table.
Re: The Max difference (SRM=True). This actually makes sense as, while the other numbers are controlled by using the Chi Test calculation, the Max difference (SRM=True) is the largest difference we could see due to random chance and is not controlled by any sort of fancy stats. It will be rare to see these numbers but it’s interesting to track anyway to see the trend of outliers.
Here’s what the results look like when we plot them on a line graph.
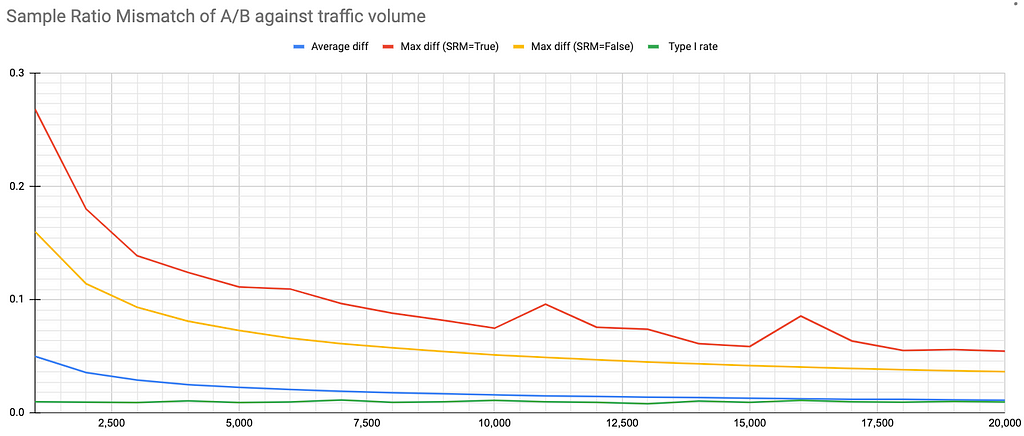
The more traffic we have, the smaller the differences we can see due to chance. At 10,000+ users assigned, the % difference between test groups before SRM triggers is <5%. At 65,000+ users this % difference drops to < 2%. So, the Chi Test becomes more accurate.
A quick note from Lukas Vermeer on this before we continue:
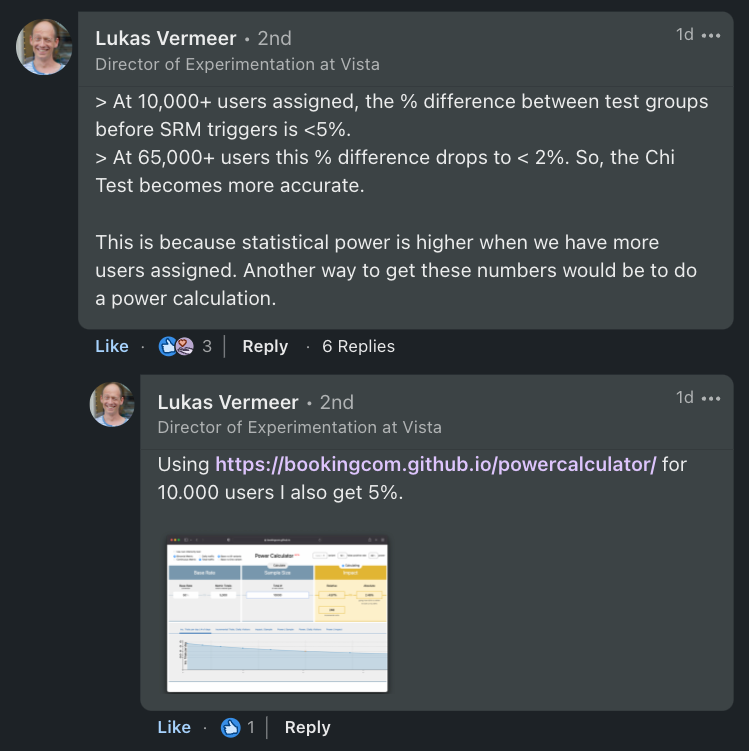
Basically, you can run a power test to get a similar value as Max difference (SRM=False). It’s probably easier than running this expensive simulation, but then again, I like doing things the hard way!
Here’s a graph of the standard deviation to demonstrate how the spread of data reduces as traffic volume increases:
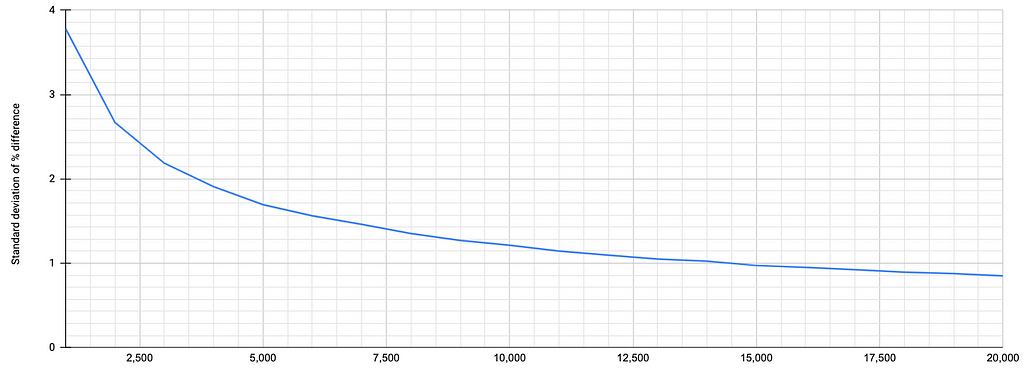
We can see that the standard deviation drops to below 1 at 15,000 users assigned. And overall the standard deviation gets progressively better as the spread of the differences between groups reduces.
Now, I’ll be the first to admit that all of this is kind of “Well, duh. Obviously.” But my goal here is to illustrate how all of this works. It might help to light bulbs in people’s heads.
But wait, there’s more…
Step 6: Continuous monitoring
All this is good, but there is an issue with continuous monitoring. Here’s Michael Lindon to tell us more about that:
“..many practitioners incorrectly continuously monitor their experiments by repeatedly performing significance tests, usually in an ad hoc fashion, without any multiplicity correction, unknowingly increasing their chances of a Type-I error.”
Quotes from Michael Lindon’s article: A Better Way to Test for Sample Ratio Mismatches (SRMs) and Validate Experiment Implementations.
Basically, the more often we check, the higher the risk of seeing a false positive. It was for this reason that we use a p-value of < 0.01 for detecting SRM (again, read my previous article for details). Lukas Vermeer’s SRM Chrome Extension tool also uses < 0.01.
This is a higher bar of significance which hopefully reduces the risk of a false positive. But does it?
Let’s find out with a quick modification of my script:
def traffic_sim(increment, checks):
    traffic = []
    a,b =0,0
    for c in range(checks):
        for i in range(increment):
            if randint(0,1) == 1:
                a +=1
            else:
                b += 1
        traffic.append((a,b))
    return (traffic)
I have two loops. We use these loops to create an list of tuples (for A and B traffic). This list of tuples increment by value: “increment”. The number of items in the list simulates the number “checks” we want to do.
This should simulate a user repeatedly checking for SRM as traffic increases.
For example, here I simulate 10 checks where the user is checking at increments of 100 users.
traffic_sim(100, 10)
Output:
[(46, 54),
 (97, 103),
 (151, 149),
 (210, 190),
 (257, 243),
 (310, 290),
 (359, 341),
 (417, 383),
 (467, 433),
 (516, 484)]
Yeah, yeah, I know. Send through more traffic. Not only that, this only simulates a single experiment. Why should increase our sample size and check for SRM Type I errors at the same time.
We can do this using the following additional function:
def get_false_pos_incremental(samples, increment, checks):
    list_dictionary = []
    for x in range(samples):
        traff = traffic_sim(increment, checks)
        for t in traff:
            list_dictionary.append( srm_check( t ) )
return ( get_false_positive_rate(list_dictionary) )
It’s another loop for the number of “samples” I want to run.
I also run the Chi Test to check for SRM (the same function defined earlier). Finally, I pass the results into my previously defined “get_false_positive_rate” function to get the % of false positives.
View the full Python code here.
I run this:
get_false_pos_incremental(samples=10000, increment=100, checks=1000)
That’s 10,000 experimenters, checking for SRM 1,000 times, while the traffic increments by 100 total users.
So, what’s the result? What’s the risk of getting a Type I error when monitoring continuously like this when we set our Chi Test p-value to <0.01?
1%
According to my results, the risk of continuous monitoring is 1% — i.e. no different than monitoring once for a test.
Note: I’m totally up for my code and subsequent findings to be peer reviewed. I’m hoping I haven’t made any errors in my logic. If I have, let me know and I will update this post and message on LinkedIn explaining the corrections that needed to be made. For now, I’m sticking wit this conclusion.
Conclusion
To wrap this up, let’s go through some questions you may now be asking yourself (if I’m missing any, be sure to hit me up either here or LinkedIn).
Is it reliable to run SRM checks when traffic is low?
If you’re using the Chi Test, it doesn’t matter when you run the check. The false-positive rate is always 1%. However, you may expect to see larger variances when traffic volumes are low.
When should I start running SRM checks?
You can, and should, run SRM checks as early as possible but use Chi to determine SRM. Don’t just go by the percentage difference you observe.
Is there a risk with continuously monitoring for SRM?
Not according to my findings. The risk of getting a Type I error when continuously monitoring for SRM is 1% when Chi Test p-value is <0.01.
Is there an optimal number of assignments where the differences between groups normalise?
The % difference between groups gets narrower over time and the accuracy of the SRM check gets progressively better (as in, it becomes more sensitive to smaller differences) as traffic increases.
I can’t give you an optimal number of assignments for normalisation. It’s a gradual process. See “Step 5” above for details.
In short, test for SRM early. Test often. Use the Chi Test, it’s easy. You can even run it in a spreadsheet! See my previous article for details.
Hope all that was useful. If you have questions, feel free to connect and ask away. Happy to talk about it.
About me, the “author”
I’m Iqbal Ali. I help companies with their experimentation programs. This means designing, developing, training, and consulting with them to set up effective experiment processes in-house.
I’m also a writer of comics, former Head of Optimisation at Trainline, creator of the A/B Decisions tool. Here’s my LinkedIn if you want to connect. Or follow me here on Medium.
Sample Ratio Mismatch: So many questions. How to answer them? was originally published in Towards Data Science on Medium, where people are continuing the conversation by highlighting and responding to this story.
from Towards Data Science - Medium https://ift.tt/S83LuRi
via RiYo Analytics


No comments