https://ift.tt/Ra9JsOL Learn callbacks in Plotly Dash and make your plots interactive Pic credits : Jason Coudriet (Unsplash) Imagine y...
Learn callbacks in Plotly Dash and make your plots interactive

Imagine you want to showcase the sales of a retailer at different levels — regions, states, countries, year. How will you do it? Will you create 4–5 different static graphs or would you like to create one where you could do all of this by using an interactive plot? If you want to pick the 2nd alternative then this blog will be helpful for you.
Possible with Plotly Dash!
We can easily create interactive plots in python using Plotly dash. With Plotly Dash, we don’t have to learn Javascript to add interactivity to our plots, we can do that using python. Dash is open source and the applications build using this framework are viewed on the web browser.
If you want to learn more about Plotly dash, then you can check out this course that will take you from basics to the advance level: https://bit.ly/311k37f
Adding Interactivity!
Adding interactivity to your plots is a 2 step process :
- Create the layout where you will add the elements such as dropdowns, plots, buttons, sliders, etc.
- Create the callback that will connect the dropdowns, slider, etc to your plot. Callbacks add interactivity to your plots.
Let’s understand this by looking at a couple of examples :
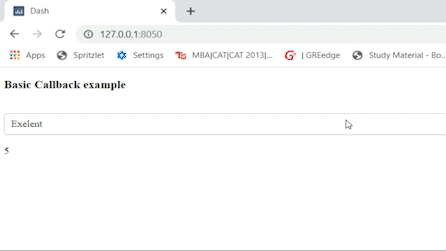
Example 1: Basic Callback
In this example, we will look at the basic callback functionality. We will create a dropdown having the rating of a course(Excellent, Average, Below Average) and print the numeric value corresponding to the ratings(5,3,1) below the dropdown. As we change the selection within the dropdown, the printed value will get updated based on the selection (as seen below).
1.1 Installing & Importing the packages
Let’s start by installing the required packages. We need dash package for initializing the app and setting the callback, dash-html-components for creating the layout, dash- core-components for creating dropdown, graphs, etc. You can use Anaconda Spyder, a python development environment, for running the codes.
In the following code, we are importing the installed packages. Input and Output will be used to create our callback.
1.2 Create the Layout
Within the layout, we can define all elements that we can want to showcase. In this example, we want to showcase a heading, a dropdown, and a textual output (using div component) in our layout.
The layout is created using html.Div component, which is a sort of wrapper around the elements of the layout. The Div component has 2 arguments :
- id : Unique identifier of the div component.
- children : Argument for setting the components of the layout. Within this argument, we are setting the heading, dropdown and textual output of the layout.
Within the dropdown function, we set the unique identifier ‘id’ to ‘dropdown’, ‘options’ to a list of label and value corresponding to these labels, and ‘value’ to 5 which is the default selection of the dropdown.
Below the dropdown, we are setting the Div component which will return the value corresponding to the selection of the dropdown. Let’s understand more about the callback below.
1.3 Create Callback
In this section, we will learn how the output changes based on the selection of the dropdown.
A callback is initialized using @app.callback() and is followed by the function which gets triggered with a change in the selection of the dropdown(input component). The dash callback has the following arguments :
- Output: Output function points to the component within the layout which gets called/updated with the object returned by the function below the callback (basic_callback()).
The output function takes 2 arguments — 1) component_id: It defines the id of the component that we want to update with our function basic_callback. We want to update the text using the Div component, so we set the component id to the id of the Div component ‘output-text’. 2) component_property defines the property of the component that will be updated based on the object returned by the basic_callback(). In this example, the children property of html.Div (part of our layout) will be updated with the value corresponding to the dropdown selection.
2. Input : This is used to define the components, the change in whose value will trigger the callback. Input function also takes component_id and component_property as argument. We want the callback to get triggered based on change in the value of our dropdown, so we set the component_property to ‘value’ property of dropdown. Please note that Input is defined within a list.
The component property of the Input function, which is set to ‘value’ of the dropdown, goes as an argument within the function basic_callback. The basic_callback function returns the dropdown value to the children property of html.Div using the Output function of the callback.
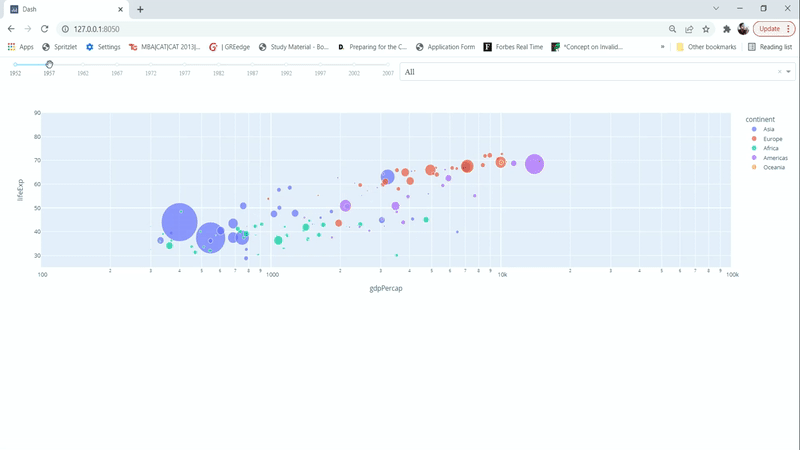
Example 2: Graph-based callback
In this example, we will learn how to connect a slider and a dropdown to a graph/plot. The graph will show how GDP per capita and life expectancy varied over the years for different countries of the world. The graph will get updated based on changes in the selection of the slider (year) and the dropdown (continent), as shown below.
2.1 Create the layout
We create the layout with a slider, a dropdown, and a graph component in the code below. The output of our callback function will be returned to the graph component.
2.2 Create the callback
In this step, we create a callback that has 2 input components corresponding to the slider and the dropdown and one output component corresponding to the graph.
Inside the callback, we are filtering the dataset based on the input from the slider and dropdown and updating the scatter plot. The plot object (fig) is returned to the figure property of the graph (dcc.graph).
If you find this useful then you can show your liking by sharing a clap and a comment. You can follow me if you want to learn about the developments in the field of data science.
How to Create Exciting Interactive Plots in Python was originally published in Towards Data Science on Medium, where people are continuing the conversation by highlighting and responding to this story.
from Towards Data Science - Medium https://ift.tt/bCcGO02
via RiYo Analytics


No comments