https://ift.tt/ZYF5I4B Combine analytics with Blue Ocean Strategy to generate new clients, increase profits, and create employee and custom...
Combine analytics with Blue Ocean Strategy to generate new clients, increase profits, and create employee and customer loyalty
Part 2: Creating New Markets

(This paper was published previously in Open Data Science, on January 25, 2022, on https://opendatascience.com/using-data-science-to-develop-a-winning-business-strategy-part-2/.)
In the first part of this series, we began to examine the role data scientists can play when creating a great business strategy that makes competitors irrelevant. That role begins by creating a strategy canvas, using a set of concepts developed by W. Chan Kim and Reneé Mauborgne (2015) in their famous book called Blue Ocean Strategy. Getting the strategy canvas right is a key factor in its success; getting it wrong can lead to wasted time and money.
The Kim and Mauborgne (K&M) text is not related specifically to data science. In this three-part series I add a data science perspective to their concepts. I describe how data scientists can work with others across every organizational unit to develop a profitable business strategy, get more clients and enhance their satisfaction — without interference from existing competitors. Here, in Part 2, I describe how data scientists can use the strategy canvas and other tools to help do that.
Part 3 will focus on managing efficiencies in blue ocean strategy and on gaining support for it by aligning incentives in its favor. Since strategy is long-term in nature, Part 3 also describes how data scientists can help renew blue oceans and avoid traps that might subvert it. Finally, limitations are noted and conclusions about how data scientists can contribute to blue ocean success are provided.
A Brief Recap — What is The Blue Ocean, and What Role do Data Scientists Play in it?
According to K&M, and as mentioned earlier in Part 1, the blue ocean is where potential clients work but your competitors do not (not yet, anyway). Quoting from their text (page 18), the blue ocean is where you can:
· Create uncontested market space
· Make the competition irrelevant
· Create and capture new demand
· Break the value-cost trade-off
· Align the whole system of a firm’s activities in pursuit of differentiation and low cost.
The blue ocean is business nirvana — there are no competitors to whittle away profits yet and it is easier to make a reputation for innovation in it. Getting there is not easy, but data science can help.
In a nutshell, the role of data science in blue ocean strategy is to provide insights needed by team members across the business, to help them find blue oceans and thrive there. Those insights arise from ten principles K&M describe. These are listed below.
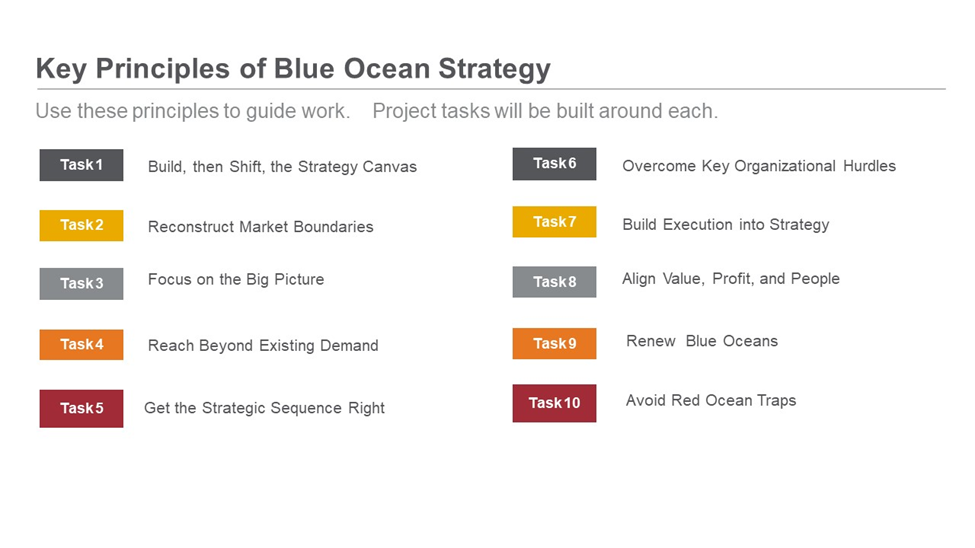
Building the Strategy Canvas
According to K&M, the first task for the data scientist and others is to construct a strategy canvas, then shift it to focus on aspects of your modeling efforts that clients find more valuable. These aspects might therefore appeal to prospects (potential new clients) who have problems your firm can solve, but who are not in your current market space. Thus, the purpose of this task is to better understand the kinds of value that clients are most interested in purchasing. K&M describe the strategy canvas as “an analytic framework that is central to value innovation and the creation of blue oceans” (p. 27). Part 1 of this series described how to build the strategy canvas. Here in Part 2 we pick up the conversation by showing how to use it to reconstruct market boundaries and create new markets for the offerings data scientists help build.
Reconstructing Market Boundaries
According to K&M, the second major task for blue ocean strategizing is to reconstruct market boundaries. Their idea is to expand your market by finding new clients who you would not normally serve. The six paths they identify for working in this new market are described briefly in the next figure.
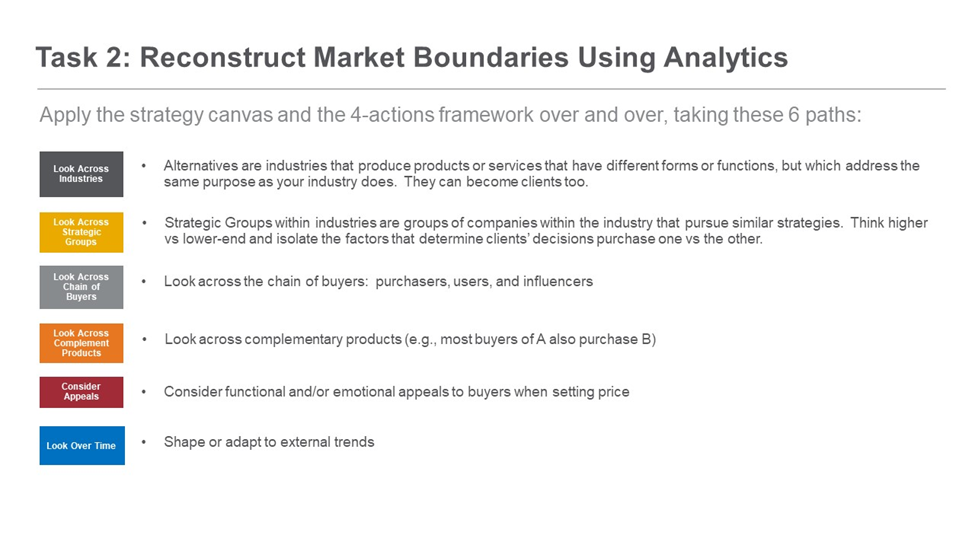
Tactically, these six paths help firms reapply their strategy canvas several times, each time focusing on providing value to new companies who have similar problems to solve. LinkedIn’s company descriptions can help identify potential new clients.
New clients also might include various groups within existing markets who have not been the focus of much effort yet. These strategic groups become of greater focus as markets shrink or saturate, when earlier groups of focus become well served. Strategic groups may also arise as the technologies required to serve them become available.
From an analytics perspective, the task of expanding market boundaries is straightforward because the kinds of analytic models data scientists use are well suited to cross-industry applications. Many of the same kinds of classification or regression modeling approaches can work well for healthcare applications, or for applications in education, public policy, environmental health, defense, retail, food distribution, and other industries where health and well-being of employees and customers are critical for success.
The most difficult part of a prediction task for a new industry or strategy group is more likely to be acquiring the subject matter expertise required to generate useful models. Investments in this realm are keys to success because industry expertise cannot easily be replaced by non-human technologies.
An Example
The efforts involved in reconstructing market boundaries can be illustrated by a healthcare industry example. In the last few years there have been many efforts to make access to healthcare services and utilization of medical treatments more equitable across all minority and majority populations. The goal of these efforts is to improve health and wellbeing throughout society. There has been a corresponding movement to apply person-centered care, making sure the needs of individual patients drive the use of appropriate treatments, regardless of their demographic, economic, and social characteristics.
The role of data science efforts in these movements is described in the following figure, which has its roots in the Cross-Industry Standard Process for Data Mining (Chapman, et al., 1999) and an updated version of it called the Data Science Lifecycle (Stirrup, 2017). More information about these can be found in my earlier paper, which presented yet another (my) Data Science Lifecycle figure you see below. That paper described several ways data scientists can use the scientific process it depicts to address health equity and social determinants of health (SDOH — see Healthy People 2030 for a discussion of SDOH).
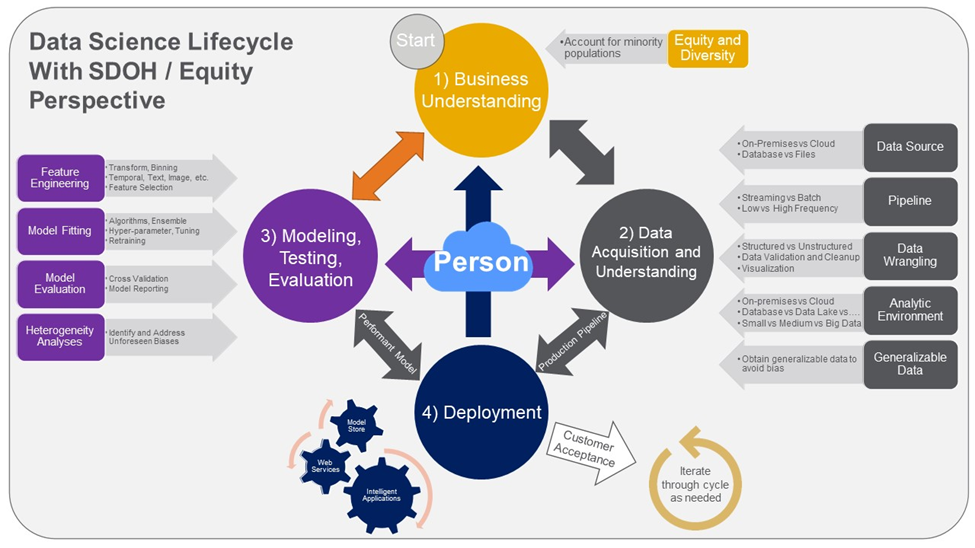
Here I want to focus on the strategy aspects of my Data Science Lifecycle. The first path towards reconstructing market boundaries that was shown in the Task 2 figure above is to look at alternative industries that address the same purpose as your industry does. Arguably, the social services industry (e.g., the firms addressing educational services, homelessness, food scarcity, transportation problems, environmental problems, etc.) is working to solve many problems that also produce poor health. Thus, the predictive models and visualizations that data scientists working in healthcare settings produce when they use the equity- and SDOH-focused Data Science Lifecycle are of value to firms in other social services industries too, so we can look to those related industries as targets of blue ocean expansion.
The second path towards reconstructing market boundaries shown in the Task 2 figure above is to focus on strategic groups within one’s own industry or within alternative industries. The focus on health equity and social determinants of health that is denoted in my Data Science Lifecycle can be viewed as an expanded focus of health-related predictive or inferential models and visualizations, tailored to different demographic and socioeconomic subgroups. Our models, inferences, and visualizations can be quite usefully applied as sensitivity analyses to determine how robust those models are, and to show how they should be refined to serve members of different groups. Doing so can expand markets and create new clients who also serve under-represented minorities.
Next, looking across the chain of buyers and across complementary products as noted in the Task 2 figure helps us focus our models on particular influencers, purchasers, and users who are most interested in gaining utility from the models, features, or other products that data scientists produce. The same notion applies when looking across complementary products — if we know clients who buy offerings based on particular types of data science models or features also buy other particular offerings, we can refine or expand our models or modeling features to create more products that would produce utility for those buyers. This allows data scientists to contribute even more to market expansion.
As noted in the Task 2 figure above, the fifth path to take when reconstructing market boundaries is to consider functional or emotional appeals to buyers when setting the prices for one’s offerings. This creates two opportunities for data scientists. One is to generate an understanding of psychological or cognitive factors that determine client utility, and then measure those with variables that contribute to better performing data science models. The second opportunity is to conduct experiments where those variables are changed systematically, to better understand and then predict buyer behavior. This will also help create new clients.
Finally, as noted in the Task 2 figure, the last path to reconstructing market boundaries that K&M mention is to shape or adapt to external trends in the market. These should influence our models because failure to do so would cause model performance to degrade over time. Data scientists should work with others across the firm to continually update their understanding of how markets work and what potential buyers want. The ability to forecast better can create opportunities for expansion in red and blue oceans.
The Value of Visualization
Our focus so far has been on models or model features. Corresponding visualizations have been mentioned in passing, but the next task in the blue ocean strategy process can benefit greatly by the visualizations that data scientists produce, so let’s focus more on those for a moment.
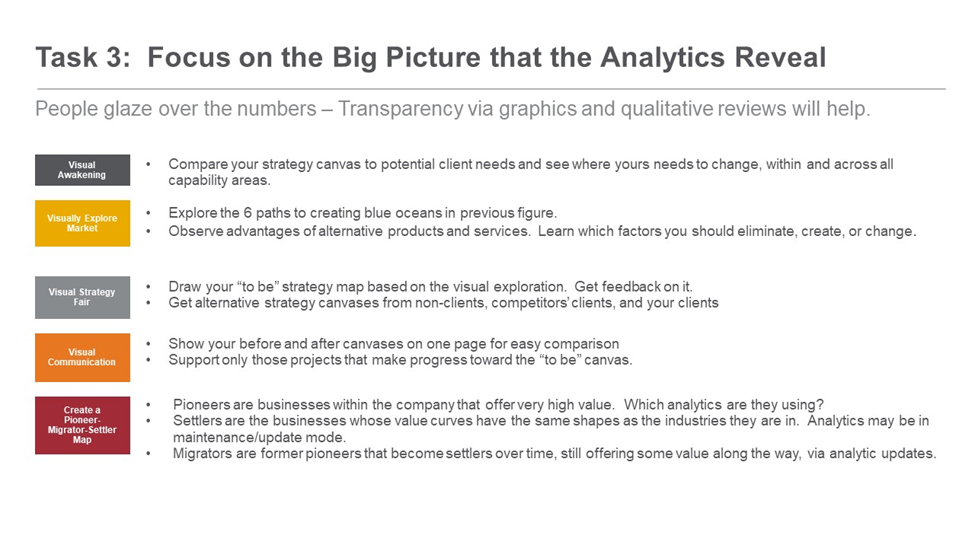
Task 3 of the process relies heavily on visualization exercises, because, as K&M state, people often get lost in numbers, glazing over results illustrated by tables. Many people are more comfortable with pictorial views. If the picture is worth a thousand words, it is up to the data scientist to make sure the correct thousand words are implied by visualizations of their models.
Many statistical packages come with corresponding visualization tools to help accomplish this end. I have found the visualizations from the SAS Visual Data Mining and Machine Learning (VDMML) package to be quite useful. In contrast to open-source tools such as Python and R, many visualizations in VDMML can be produced with very little extra coding. The visualizations in VDMML are informative and fast. Nevertheless, the variety of visualizations available in open-source tools remains impressive, being useful for all stages of the data science lifecycle. Aishwarya Ajaykumar (2021) provides over two dozen examples of how to create useful visualizations in Python, for example. Thuwarakesh Murallie (2022). Tableau also offers great visualization capabilities; these tend to be used early in the data science process, when data are first ingested, cleaned, and described in pictorial views to help generate an early or model-agnostic story.
Readers may be familiar with many other visualization processes as well. For example, Jair Ribiero (2022) describes how data scientists can use network graphs to help tell stories with data that are hard to glean otherwise.
The utility of visualization in strategy development is three-fold. First, as with many data science applications, visualizations help analysts and their clients understand the stories the data are telling, in easily digestible ways. This builds confidence in the modeling process and in the results generated from that process. Second, the visualizations can illustrate many different versions of the strategy canvas, as suggested in the Task 3 figure above. Getting feedback on each of these can help product developers and others land on the best combinations of models, features, or other product attributes that pave the way for blue ocean success. Third, visualizations aid understanding of pioneer, migrator, and settler businesses, helping strategists to make better choices about where to invest limited dollars in new offerings, versus updating and maintenance of existing ones.
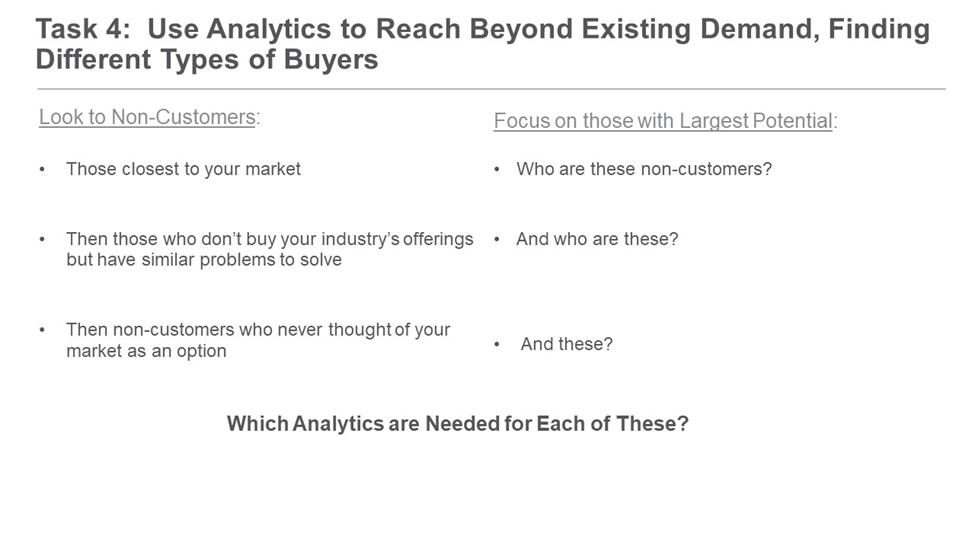
Reaching Beyond Existing Demand
According to K&M, the next task in the blue ocean strategy process is to reach beyond existing demand to find new buyers. Analytics produced by data scientists facilitate this process. Intelligence from the literature and from sales, marketing, product development, and other staff can help the analysts focus their work in this endeavor. That work is described in the Task 4 figure below. Deciding which non-customers to focus on can help everyone understand the best models and features to generate, either as stand-alone products or as components of larger offerings.
Wrapping Up and What is to Come
So far in Parts 1 and 2 of this series we’ve introduced the blue ocean strategy concept and process, emphasizing the value of the strategy canvas. That line graph illustrates the value clients are expected to get from analytics produced by data scientists, among other offerings. Since the focus of blue ocean work is on how to transform potential value into real value for new clients in other industries, or for new groups in existing markets, we’ve shown how data scientists can facilitate that work, collaborating with other parts of the business. In Part 3 we will focus on how to conduct this work efficiently, how to surmount organizational hurdles when performing blue ocean work, and how to align incentives for internal and external stakeholders, to help ensure success. We will also focus on renewing blue oceans once competitors catch onto those new markets, and how to avoid competitive threats and traps that would force one to leave the blue ocean. Limitations of the approach and of the material in this series of papers will be noted, and final conclusions will be provided. Please join us; that information is coming shortly.
References
A.Ajaykuman, An Intuitive Guide to Data Visualization in Python (2021), Analytics Vidhya, on https://www.analyticsvidhya.com/blog/2021/02/an-intuitive-guide-to-visualization-in-python/.
P. Chapman, J. Clinton, and R Kerber, et al., CRISP-DM 1.0: Step-by-step Data Mining Guide (1999), on https://www.the-modeling-agency.com/crisp-dm.pdf
Healthy People 2030, Social Determinants of Health, on https://health.gov/healthypeople/objectives-and-data/social-determinants-health
W.C. Kim and R. Mauborgne, Blue Ocean Strategy (2015), Harvard Business Review Press, Boston, MA
T. Murallie, Create Stunning Visualizations with Pandas Dataframes in one line of Code (2022), Towards Data Science, on https://towardsdatascience.com/advanced-pandas-plots-e2347a33d576
R. Ozminkowski, What do 101 Dalmations and Machine Learning have in Common? (2021), Toward Data Science, on https://towardsdatascience.com/what-do-101-dalmations-and-machine-learning-have-in-common-9e389b899df3
R. Ozminkowski, Using Data Science to Develop a Winning Business Strategy, Part 1, Open Data Science (January 20, 2022), on https://opendatascience.com/using-data-science-to-develop-a-winning-business-strategy-part-1/
J. Ribiero, A Gentle Introduction to Network Graphs and how we can Visualize our World (2022), on https://jairribeiro.medium.com/a-gentle-introduction-to-network-graphs-and-how-we-can-visualize-our-world-connecting-the-dots-6bb5a2db5558
J. Stirrup, What’s Wrong with CRISP-DM, and Is There an Alternative? (2017), on https://jenstirrup.com/2017/07/01/whats-wrong-with-crisp-dm-and-is-there-an-alternative/
Using Data Science to Develop a Winning Business Strategy, Part 2 was originally published in Towards Data Science on Medium, where people are continuing the conversation by highlighting and responding to this story.
from Towards Data Science - Medium https://ift.tt/UmVRI54
via RiYo Analytics


No comments