https://ift.tt/3EUm7zi Photo by Greg Rakozy on Unsplash A comprehensive guide to my data science knowledge If you’d like to copy part...

A comprehensive guide to my data science knowledge
If you’d like to copy parts of this guide for your own reference in Notion, you can access the Notion version of the guide here.
Table of Contents 📖
(1) Introduction
(2) Explanation of Tools
(3) Basic Python
(4) Pandas
(5) Visualization
(6) Machine Learning
(7) SQL
(8) Statistics
(9) Portfolio Building
(10) Newsletters
(11) Productivity
(12) Conclusion
1. Introduction 📝
1.1 What is this guide?
This is a (work-in-progress) comprehensive guide to all the data science knowledge that I’ve accumulated in the past ~2 years. It doesn’t cover everything in data science overall, just the subset of topics that I personally find to be interesting and useful. Essentially, it’s the guide that I wish I had when I first started my data science journey.
I love reading science fiction, so this guide is named after Douglas Adams’ book The Hitchiker’s Guide to the Galaxy.
1.2 Why did I make this guide?
I made this guide for two main reasons. The first is that I didn’t have much guidance when I started learning data science and, as I still haven’t found anything close to a “comprehensive data science guide”, I thought I’d try my hand at making one myself based on my experience. This guide can serve as some kind of starting point for someone who’s just getting into data science, or it can help someone more experienced learn something new.
The second is that in my personal experience, both independently or in school, learning new things can be very slow and can be made significantly more efficient with help from someone who’s already gone through it. My first foray into data science consisted of scraping + cleaning college volleyball player data for 40 hours, and then realizing I didn’t have the skills yet to do any real analysis on it. I’ve spent countless hours learning skills that I don’t really need, and countless more hours inefficiently learning the skills that I do need. This guide will ideally prevent others from going through the same wastes of time.
Ultimately, I hope that this guide allows people to learn the things that I now know in a much more efficient manner than I learned them.
1.3 Who am I?
I’m Ryan Brown, here’s my personal website and my LinkedIn profile. I wrote my first line of code in January 2020 in my intro Python class as an MIS major at UT Austin. There are other classes I’ve taken for my major or CS certificate that teach data science skills, but the majority (I would estimate 90%+) of my skills have been self-taught.
My freshman summer I interned at two data-centered startups in Austin, my sophomore summer I was a data science intern at Dell, and this upcoming summer I’ll be a data science intern at Meta (Facebook).
1.4 What do I do?
I would consider myself to be an analytical, product-focused data scientist; my work consists of collecting, cleaning, analyzing, visualizing, and occasionally modeling data, ultimately leveraging these skills to create data-driven narratives, drive decision-making, and deliver actionable insights. I apply machine learning models, but I’m not particularly interested in the math behind them or building my own models from scratch. I don’t write SWE-level production code, and my main work environment has been Jupyter notebooks. Some people might consider what I do to be “data analytics” instead of “data science”; I don’t think it matters.
This post by Benn Stancil on using time to decision as a metric for measuring analytical work is super insightful and sums up pretty nicely how I feel about what I do and how I should be measured.
1.5 How is this guide structured?
Each technical section has three subsections: “Resources”, “My Perspective”, and “How to Practice”. “Resources” contains a list of resources that I would recommend using to learn that skill and a description of that resource + how you can use it. Many of the primary resources are guides I’ve created that aggregate all my experience with that skill. “My Perspective” contains my thoughts on the resources for that skill, the importance of the skill as a whole, and how it fits into my toolbox. “How to Practice” contains methods that helped me learn the skill or methods that I wish I had used to learn the skill. The methods are in no particular order.
All sections beyond section 2 are meant to stand alone; some skills obviously do build on each other, but you could read only the “Pandas” section (section 4) and understand the resources, perspective, and practice without having to read the preceding “Basic Python” section (section 3) or the following “Visualization” section (section 5). You could also read the “Portfolio Building” or “Newsletters” sections without reading anything else and still get value.
1.6 How to use this guide
Following this guide from start to finish would (theoretically) result in a journey and experience that mimics my own; I don’t think that my approach to data science is the “best approach” by any means, though, so mimicking me isn’t necessarily the goal.
This article by Dan Luu discusses the dilemma of deciding what to learn, and I totally agree with his perspective. Following “learn what I learned” advice won’t always work, because everyone has different natural strengths and weaknesses — Dan proposes that beyond glaring holes in experience, you should focus on amplifying your natural strengths rather than eliminating weaknesses. The two “ingredients” he mentions for deciding what to learn (/improve) are having a relative aptitude for something and having a good environment in which to learn that something; I’ll add that being genuinely interested in the topic is an important third factor.
So, to clarify, this guide is not meant to be “learn what I learned” advice. Rather, you can use the topics, literature, and resources covered in this guide to help you figure out what you want to learn. If what you want to learn happens to have overlap with the things I’ve learned and your environment is conducive to it, then this guide will (hopefully) help you quickly + efficiently learn those topics to the level of knowledge that I’m currently at.
2. Explanation of tools 🔧
- Python: Used for data collection, cleaning, manipulation, analysis, visualization, modeling. Python is the primary tool I’ve used for data science, and a significant portion of the information in this guide relates to learning + applying Python.
- R: Similar to Python, but my experience with it has been limited and I prefer Python. This guide doesn’t include content on R.
- SQL: Used a lot in the real world to query + transform data (especially large datasets), but I find it difficult to incorporate into personal projects. This guide gives resources for learning and practicing SQL, but it’s not a primary focus.
- PowerBI/Tableau: BI tools used to create dashboards, these are easier to use in personal projects — since a project could be a dashboard — but this guide doesn’t include content on them because I don’t feel that I’m especially experienced in using them. Additionally, once you conceptually know how to visualize data, these amount to just looking up the tool-specific interface and syntax.
3. Basic Python 🐍
Python is an interpreted, readable, and versatile programming language that is one of the primary ways data scientists code.
3.1 Resources
Google’s “Welcome to Colabatory” notebook
- Introduces Google Colab as a development environment. I recommend reading this first so that you’re acquainted with what a Python notebook is.
- This section of my Pandas Guide covers getting set up with Colab, Python data types, and useful Colab markdown and shortcuts. I recommend reading this after you’ve set up a Colab notebook so that you can become more comfortable with the development environment.
Corey Schafer’s “Python Programming Beginner Tutorials” playlist on YouTube
- A playlist of YouTube videos by Corey Schafer that covers the basics of Python. I haven’t used this entire playlist personally, but I’m a fan of his videos and watched a few of them on this playlist instead of trying to learn from my class. I would recommend using Colab instead of the setup he describes, and the videos that I think are useful are 2–9 (tutorial for beginners topics), 17 (datetime), 19 (sorting), 20 (try/except), and 23 (requests). I don’t think that file I/O is useful.
3.2 My Perspective
I learned basic Python from my intro Python class, but I thought it was paced pretty slow and there are a lot of different ways out there to learn. Because I didn’t use online resources I can’t give a first-hand recommendation, but I did watch quite a few of Corey Schafer’s videos on Youtubefor clarification and they were great. Linked here is his “Python Programming Beginner Tutorials”, which has a lot of great videos. I recommend using Google Colab as your IDE, though; here is Google’s intro Colab notebook, and my Pandas guide in the next section also has an introduction to Colab.
3.3 How to Practice
Follow along with the code in Corey Schafer’s videos in your own Colab notebook.
Complete assignments or projects for intro to Python classes; below are some results that came up when I searched “intro python class assignments” as well as some that I found from UT Austin; I haven’t looked at any of these in detail.
- https://ocw.mit.edu/courses/electrical-engineering-and-computer-science/6-189-a-gentle-introduction-to-programming-using-python-january-iap-2011/assignments/
- https://www.rbvi.ucsf.edu/Outreach/pc204/assignments.html
- https://www.cs.utexas.edu/~scottm/cs303e/Assignments/index.htm
- https://www.cs.utexas.edu/~byoung/cs303e/syllabus303e.html
4. Pandas 🐼
4.1 Resources
My comprehensive Pandas Guide on Colab
- A Colab notebook I created that compiles everything I’ve learned about Pandas throughout my data science journey. I recommend reading this all the way through, and creating a duplicate so that you can run + experiment with the code as you read it. You can also modify the guide itself so that it makes more sense for you.
Corey Schafer’s “Pandas Tutorials” playlist on YouTube
- A playlist of YouTube videos by Corey Schafer that covers various Pandas topics. I haven’t watched or used this playlist personally, but I’m a fan of his videos. I recommend using these videos for a more in-depth explanation of concepts that are still unclear after reading my guide.
Dataquest.io’s Cheat Sheet, Enthought’s Cheat Sheet, DataCamp’s Cheat Sheet, Dataquest.io’s Regular Expressions Cheat Sheet
- Three Pandas cheat sheets from various data science websites. I don’t use these myself but they provide some visual explanation of topics and you may find them useful to reference while coding. I do use the regular expression cheat sheet.
4.2 My Perspective
Pandas is designed to be straightforward to use. The way I think about it is that you should first figure out conceptually what you want to do to the dataset, then implement it using the proper syntax. My Pandas guide is meant to be comprehensive and can be used both to learn a good chunk of Pandas functionality as well as to reference while you’re coding so that you don’t have to constantly look up syntax. If there’s something you want to do that isn’t in the guide, once you’ve looked it up and figured it out, add it to your copy of the guide!
4.3 How to Practice
Complete practice interview questions using Pandas on StrataScratch.
- Useful because you can check your answer for free on a lot of the questions — this helps confirm that you’re coding properly and getting the hang of it.
- These questions aren’t exactly representative of how analysis looks in practice and the coding environment is less than ideal, but it’s a good way to get started with cleaning, manipulation, and aggregation.
Grab an interesting dataset from Kaggle, load it in Colab, and start exploring.
- To be more targeted, you can generate a set of questions that you have about the data and then try to answer them by exploring/manipulating the data using Pandas.
5. Visualization 📊
Visualization is a major part of exploratory data analysis and communicating analysis results to both technical and non-technical stakeholders.
5.1 Resources
My comprehensive Plotly Data Visualization Guide on Colab
- A Colab notebook I created that compiles everything I’ve learned about Plotly Express, which is my favorite visualization library. Similar to my comprehensive Pandas guide, I recommend reading this all the way through, and creating a duplicate so that you can run + experiment with the code as you read it.
Corey Schafer’s “Matplotlib Tutorials” playlist on YouTube
- A playlist of YouTube videos by Corey Schafer that covers various kinds of charts and customization in Matplotlib. I haven’t watched or used this playlist personally, but I’m a fan of his videos. I recommend watching this if the Plotly guide feels overwhelming and you’re relatively new to data visualization.
My Seaborn Reference Guide on Colab
- A reference Colab notebook I created for myself for creating different kinds of visualizations in Seaborn. I recommend referring to this while coding after you’ve already learned the basics of Matplotlib and Seaborn; it can also be used as a brief showcase of Seaborn’s capabilities.
5.2 My Perspective
The “golden standard” for data visualization in Python is Matplotlib (and, by extension, Seaborn), and I used to be an avid user of those tools. However, this past summer at Dell I found Plotly (specifically Plotly Express) to be much more useful, for the main reason that its charts are interactive. I explain in more detail why I prefer Plotly in the introduction section of the Plotly guide linked above.
I still think that Matplotlib and Seaborn are useful, especially for quickly plotting toy data or arrays of values (such as model accuracies), so I’ve included resources for learning those as well. It’s good to learn all three, but I personally believe that focusing on Plotly is the most effective. In the real world, you’re not often going to visualize a dataset without aggregating it first, and if you’ve already aggregated the data then Plotly is the way to go.
5.3 How to Practice
Grab an interesting dataset from Kaggle, load it in Colab, and start exploring.
- To be more targeted, you can generate a set of questions that you have about the data and then try to answer them by exploring/manipulating the data using Pandas and visualizations.
- The visualizations can be used to help document + present your answers to others.
Data hackathons.
- There are various kinds of data science competitions, but what I mean by a data hackathon is a competition where you’re given a broad task and you have to solve it by analyzing data, with the most common deliverable being a data-driven narrative presentation.
- Data hackathons (and examples) are covered in more detail in Section 10 (Portfolio Building).
6. Machine Learning 🤖
Machine learning is used for various complex tasks such as classification, regression, clustering, and NLP, and the model can be a deliverable itself or it can be used to validate decision-making.
6.1 Resources
StatQuest’s Machine Learning Playlist
- A playlist of YouTube videos by StatQuest (Josh Starmer) on a wide range of machine learning topics. It provides a gentle introduction to many of the core ideas within machine learning so that you have a better conceptual understanding of what you’re coding.
- I recommend, at a minimum, watching the videos on ML fundamentals (1–5), linear regression (9–12), and logistic regression (which is a classification technique) (16–19) before you start coding. Scrolling through the playlist, other videos that I personally found useful + interesting are 23–24, 28–30, 33, 37–40, 42–45, 47–48, 51–52, 59, 80. All of the videos are great, but the other topics weren’t as relevant to what I personally do.
- A page on the PyCaret website with various tutorials for PyCaret, an open source, low-code machine learning library in Python. It can be used for classification, regression, clustering, anomaly detection, NLP, and association rule mining. I recommend going through all tutorials for each ML task that interests you.
- scikit-learn’s homepage. I recommend looking at the documentation for a particular function when you see it somewhere else (e.g. PyCaret)
6.2 My Perspective
As I mentioned in the introduction, I’m interested in applying machine learning models rather than building them myself. I don’t feel the need to understand how each of the 22 regression algorithms included in PyCaret works, and while I find the topic interesting, I don’t consider deep learning applications (e.g. image classification with PyTorch or TensorFlow) to be a part of my toolbox. For my purposes, understanding the basics of machine learning (from the StatQuest playlist / various readings over time) and being able to quickly apply it (using PyCaret) is enough.
I used scikit-learn a lot and generally had a strong focus on complex machine learning at the beginning of my journey because that’s what I thought it meant to be a “good” data scientist, but now I know that’s not necessarily the case. There are data scientists (or “analysts” or “engineers”) in the real world at varying levels of technical skill, from much less technical than me to much more technical than me.
Machine learning is a really easy rabbit hole to fall into, but I think each individual should strongly consider how much they actually need to know for their purposes: Do you need to know or use machine learning at all? Do you just need to be able to apply it as a practitioner? Are you interested in building and optimizing your own models? “Data scientist” is a super broad title, but I would personally categorize those who answer “yes” to the last question as ML engineers rather than data scientists.
A little aside on PyCaret: it’s awesome. With only a few lines of code, your Pandas dataframe will be automatically processed, split, and trained on all of the key model types for your task (whether that be classification, regression, or otherwise).
6.3 How to Practice
Compete in machine learning competitions on Kaggle.
- There’s a lot to learn from these competitions, even though a lot of it doesn’t fall under my area of interest. You can practice quickly getting a model built + scored using PyCaret; hone your data engineering skills; and look at the abundance of community notebooks to learn advanced techniques in various disciplines.
7. SQL 🐘
SQL stands for Structured Query Language and is used to access, clean, and analyze data stored in databases. It’s much more performant than Pandas on very large datasets.
7.1 Resources
- A series of SQL guides (basic, intermediate, and advanced) that cover most of the major topics in SQL. I recommend reading through the entire thing and creating some sort of syntax reference guide for yourself. You can find mine here, but it’s not very clean and I haven’t used SQL very extensively.
7.2 My Perspective
Mentioned in section 0, SQL is (as far as I know) very important and widely used in the real world, but I haven’t used it very much in my personal projects. Deepnote (mentioned in “How to Practice”) makes it much easier to incorporate, but I’ve always viewed it as something that I’ll learn on the job. There are definitely companies that require you to know a good amount of SQL, but I personally didn’t need it to pass the interviews for my internships so far.
7.3 How to Practice
Complete practice interview questions using SQL on StrataScratch.
- As mentioned in section 4 (pandas), StrataScratch will let you use SQL instead of pandas for most of the questions.
- There are a lot of subtleties/snippets when using SQL that aren’t apparent from just learning the syntax from the Mode Analytics guide, so doing these can help build some SQL intuition + flesh out your reference guide.
- Again, these questions aren’t exactly representative of how analysis looks in practice and the coding environment is less than ideal, but it’s a good way to get started with cleaning, manipulation, and aggregation.
Practice using SQL instead of pandas on Deepnote.
- Deepnote is a cloud-hosted Jupyter notebook alternative to Google Colab. There are a lot of things I really like about it (easily switching between multiple notebooks in a single project, easy file access, integrations), but I’ve put it here specifically because it allows you to create SQL cells where you can run SQL on a dataframe and return the result as a dataframe.
- You can go back through other personal projects or analyses and try to do as much of the data manipulation as possible in SQL rather than pandas. You can also try using SQL from the beginning.
8. Statistics 🎯
Statistics is the foundation for A/B testing and most machine learning algorithms, and can also be used to better understand the distribution of data.
8.1 Resources
My interview prep statistics notes
- All the notes I took on statistics to prepare for my Facebook data science intern interview. It’s not a comprehensive guide to statistics nor is it formatted particularly well, but it should provide some sort of baseline + put a lot of useful information in one place.
CXL.com A/B Testing Statistics, Bytepawn A/B Testing , TDS A/B Testing Article, Shopify A/B Testing Guide
- Some of the resources I read to better understand A/B testing.
8.2 My Perspective
I’ve taken a few stats classes in college, but statistics haven’t been a very large part of my data science toolbox yet. The very fundamental concepts (mean median mode, variance + standard deviation, normal distribution, quantiles, etc) are used when coding, but beyond that I haven’t used much of my knowledge. A lot of people say that heavy statistics and math are necessary fundamentals or prerequisites to be a data scientist, but I personally disagree. For an ML engineer, yes. For a product-focused data scientist who creates data-driven narratives and drives decision-making, no. It is part of A/B testing, but haven’t done that yet and I figure that if I need to learn anything beyond what I have in my notes, I can learn it on the job.
I don’t have any resources for practicing statistics because I haven’t practiced it myself (other than in my college classes, which I didn’t find to be particularly useful).
9. Portfolio Building 📁
Building a portfolio is a large part of the data science journey, as it allows you to pursue your interests through more personalized projects and you learn a lot trying to achieve your goals. This section will cover how to get inspiration for project ideas, where the data for a project can come from, and then 9 different formats that your projects could take the shape of.
9.1 Project Inspiration
There’s no magic formula for coming up with a project idea; sometimes you’ll be full of too many to even think about starting, and sometimes you won’t have any. Ideas can come from your personal interests outside of data science, from seeing the work of others, from learning a new technical skill that you want to apply, or from seeing an interesting dataset.
Below I’ve listed some websites where you can find code, projects, and articles that may help spark inspiration for your own projects.
- https://deepnote.com/explore
- https://community.deepnote.com/c/showcase/
- https://www.kaggle.com/code
- https://towardsdatascience.com/
One thing to note is that you should never hesitate to do a project because it’s “too easy” or “anyone else could do it”; there are always going to be people more skilled than you that could probably do a similar project if they wanted to, but you’re the one that’s doing it.
9.2 Data Sources
There are three main source categories that data to use in your projects can come from, listed from least to most unique:
- Existing Datasets: These are .csv files that are ready to be downloaded + analyzed, such as those found on Kaggle. There’s a huge variety of datasets, and they may have been scraped by the people posting them, but the fact the data is publicly available means that others may have already analyzed it.
- Datasets from APIs: APIs allow you to access a subset of data, often because the data updates frequently and is too large to be contained in a single .csv file. Examples are weather data, Spotify data, or Twitter tweets. A great place to find APIs is RapidAPI. When you collect data yourself from an API, while others may have access to the same kind or format of data and analyzed it in the past, the dataset you end up analyzing will be filtered based on the unique parameters you choose and thus could tell an entirely different story.
- Self-collected Datasets: Data that doesn’t exist in any easily accessible form online, so you have to collect the data yourself. It could be data that you generated (such as a manual survey, images you took, books you’ve read, etc.) or data that you have to collect from existing websites (such as articles from my school’s newspaper website, The Daily Texan). Since you’re working with a dataset that’s never been seen before, it’s more likely that your analysis will be unique.
Despite the fact that they’re less unique, I would recommend starting out with existing datasets. Doing so greatly speeds up the data collection + cleaning process and allows you to learn more quickly how to actually analyze data.
My first “data science project” ever, before I had even used pandas, consisted of me spending ~50 hours webscraping and cleaning data. Once I finally had the data, I realized that I didn’t possess the skills to actually analyze it, and I had to put the project on the backburner for over a year until I learned more using cleaner datasets. Not a very effective use of my time.
9.3 Data Hackathons / Data-driven Presentations
I would define a data hackathon as a competition where you’re given a (relatively) broad task and have to solve it by analyzing data, with the most common deliverable being a data-driven narrative presentation. A dataset is usually given, but you’re often free to utilize additional data sources.
I think that data hackathons are one of the quickest + most effective ways to learn data science and build your portfolio, for a couple of reasons:
- You have a limited amount of time (typically 24–48 hours) to compete, so you must rapidly learn and create.
- The presentation deliverable format mimics real-world data science and means you can spend more time learning how to analyze data to effectively communicate your message, and less time nitpicking code.
- A predefined dataset + task means that you’re able to bypass the project brainstorming phase as well as the data collection stage.
My entries to two data hackathons I competed in are linked below; each page also contains the information packet for the hackathon.
You don’t necessarily have to compete in the hackathon live; although you won’t actually be able to submit your entry and potentially win, if you mimic hackathon conditions you’ll get all the same experience and produce the same deliverable. If you’re not sure where to start, you could create an entry for one of the hackathons I linked above. I would recommend the second one, MLDS Datahack 2021, as I thought that task was much better + more open-ended. You can also look into Analytics Competitions on Kaggle; many of them are already finished and the deliverable typically must be a notebook, but creating a presentation entry anyways is good for practice + learning.
9.4 Data-driven Narrative Articles
Articles are a little beefier than presentations, but they’re great for practicing your storytelling skills and doing a deeper dive into a topic or dataset. Below are some examples of narrative articles using various kinds of analysis + data. Beyond these examples, you can find thousands of data-driven articles on Towards Data Science.
Exploring 4.5 Years of Journal Entries with NLP: Uses journal entry data generated by the author (me).
Does height REALLY matter?: Uses data webscraped by the author (me).
16 Going on 17: The Soundness of Various NFL Records: Uses publicly available sports statistics.
9.5 Independent Research Papers
If you’re working on a bigger, wider-sweeping project than what can fit in a single article, you may want to write an independent research paper instead. My own independent research paper on content-based recommendation systems started out as an article, but got too big and too technical.
You don’t necessarily need to work underneath a professor or some academic institution to write a research paper; notice that mine is an independent research paper rather than an academic research paper. There’s no formal definition for what constitutes a “research paper”; I worked on mine entirely by myself. It’s up to you to apply the necessary rigor, formatting, etc. I recommend Overleaf for writing papers in LaTeX.
9.6 Notebook-contained Projects
If you want to contain your code, visualizations, and narrative/text all in one place, you can create a project entirely contained by a notebook. It can be created on your own or submitted or for a competition. There are a lot of examples of these notebook projects in the inspiration links, and a more guided example is my entry for the 2021 Kaggle ML & DS Survey Competition.
A note on notebook competitions: I found that to create a notebook that was presentable on its own for the competition, it took a lot of time to polish and perfect it; more than I would have preferred to spend. I also read about and agree with the fact that presentations, rather than notebooks, are how visual stories are told in practice.
Notebook projects themselves are fine since you define the format yourself, but I wouldn’t compete in a competition with a notebook as the deliverable again. As mentioned earlier, though, it could still be valuable to use the same prompt/task but create a presentation instead. An example of a notebook project that takes advantage of the notebook format without being unnecessarily long/complex is this Goodreads Profile Analysis Dashboard on Deepnote.
9.7 Tutorials / Guides
There are thousands of tutorials out there for how to perform various data science analysis techniques, many of them in article format on Towards Data Science. If there’s some useful task you completed that you couldn’t find the a tutorial for, or if you had to combine multiple tutorials because none of them were fully adequate on their own, make your own tutorial!
I like the notebook format quite a lot for technical guides and created the ones you see in this notebook; I’ve also written an article tutorial for pushing data to data.world with Python here. Keep in mind there’s no “experience requirement” to create a tutorial; I wrote that article very early on in my data science journey, and while I know much more now, it was still useful and is a part of my portfolio.
You can also create non-technical guides or tutorials, like the one you’re reading right now.
9.8 Data Collection Pipelines
If you’re interested in collecting data that updates often and think it might be useful to others, the data itself can be a project before you do something more with it. Write the code to collect the data in a notebook or script and run the code periodically (e.g. daily). The data can then be exported to a variety of places: a SQL database, a .csv file that is then pushed to a Git repository, Kaggle.com, data.world, etc.
I haven’t completed one of these projects myself outside of internships, but there are hundreds of examples of unique datasets at Data Is Plural; the datasets are interesting enough that they’re worth mentioning even without any analysis to speak of.
I know that Deepnote and Kaggle both have the native ability to run scheduled notebooks, and you can probably do the same with a bit of effort in Colab or local notebooks.
9.9 Dashboards / Unique Visualizations
Dashboards aren’t reserved for only “data analysts” / “business analysts”, and they can be much more dynamic + interesting than what you might typically think of for a business use case (sales figures, user counts, etc). Bonus points if you create a dashboard using data (live updating or otherwise) that you collected yourself, or call from an API yourself.
I also haven’t created a dashboard outside of internships, but dashboards and visualizations of all kinds can be found on Tableau Public. In addition to a whole dashboard (which is often meant to monitor or inform), you could create a single, very unique visualization, such as this visualization of the Coffees Drank in Twin Peaks.
9.10 Data-driven Web Applications
If you’re interested in the product creation process, front- or back-end coding, have some SWE friends/peers, or want to expand your skillset beyond pure data science, building a data-driven web application can be a great (albeit quite involved) project. As part of an organization I was in, during a semester I built Moodify, a mood playlist generator for Spotify. I used React.js but that took a lot of time to learn and I’m still not great at it + won’t use it in the future, so another option is to use Bubble.io (a super powerful drag-and-drop website building that can connect with any backend) for the front and and Python Flask or Django (or anything else) for the data analysis + backend.
9.11 Python Libraries
Writing your own Python library sounds very daunting, but it doesn’t have to be. There are plenty of tutorials out there, and all you need are a couple of useful functions that you’d want to import + use across multiple data science projects. It could be code to create a certain kind of more complex visualization using an existing library,
I haven’t written a library myself but I want to at some point, and from what I understand Python makes it pretty easy. Here is a link to the tutorial I plan to follow when I get around to creating one.
10. Newsletters 📧
Most of my practical, non-technical knowledge about data science (and some of my technical knowledge) has come from reading newsletters. There are a few I’m signed up for and they have content on new things going on in the data science / general tech space, what it really means to be a data scientist, how companies have overcome various data challenges, etc. Below are the newsletters that I’m currently subscribed to.
TLDR Newsletter (Daily)
- Described on their landing page as “Byte sized news for busy techies”, every day they send out a newsletter with links + brief summaries for two articles in each of the following four categories: (1) Big Tech & Startups, (2) Science & Futuristic Technology, (3) Programming, Design & Data Science, (4) Miscellaneous.
Data Elixir (Weekly)
- More specific to data science, they send out article links + summaries on various topics within data science, such as technical skill guides, events relating to large players in the data science space, and opinionated pieces on practices in the data science industry.
Analytics Engineering Roundup (Weekly)
- More of a longer / narrative post on a single topic with quotes + links to related articles sprinkled in, it talks about a lot of different things but it’s often related to the work that a data scientist or analytics engineer does and what they should be doing, how work should be divided, new tools that change the way we do work, etc.
Data Is Plural (Biweekly)
- A biweekly newsletter from Jeremy Singer-Vine that contains various interesting datasets from around the internet.
Deepnote product updates (Periodic)
- Not really a newsletter, but Deepnote sends out product update emails every couple of weeks and there’s some pretty cool + innovative stuff going on there in the notebook space. I still use Colab (mostly because of occasional speed issues and then Colab has collapsible markdown blocks while Deepnote only has collapsible “title” blocks), but I would eventually like to switch to Deepnote and I love seeing the capabilities of a data science notebook being expanded. I’m not sure how to subscribe to the updates other than having an account.
11. Productivity ⌨
This isn’t explicitly related to data science, but I’m very invested in the productivity space and think it’s a mindset that applies well to working in and learning about data science. I’ll reference this post by Benn Stancil again on using time to decision as a metric for measuring analytical work; as data scientists we must be productive.
11.1 Calendar + Email
I use Google Calendar and Gmail, nothing fancy here. I try to keep my inbox empty, though, by filing each email into its respective folder after it’s been read. I have the following folders: data science, misc, personal, school, jobs, orders, and then one for each company I’ve worked at and one for each UT organization I’m in.
11.2 Task Management
I use Todoist for task management, and love it. I use the pro plan ($3/month), but the free plan is quite capable as well. You can organize tasks into different projects and sub-projects, create sub-tasks, give tasks descriptions and priority levels, create different filters/views, set recurring tasks, etc. The priority, date, and project can be set use natural language, so it’s super fast and easy: if I type go grocery shopping every sunday #misc p1, it’ll create a recurring task every sunday in my Misc project with priority level 1. There’s a mobile app as well, with all the same capabilities.
One very notable feature: you can set up a universal shortcut that works with Todoist and can be used no matter what you’re doing on your computer, as long as you have Todoist open somewhere. Mine is WIN + ALT + N. This shortcut opens a create task window overlaid on top of your screen:
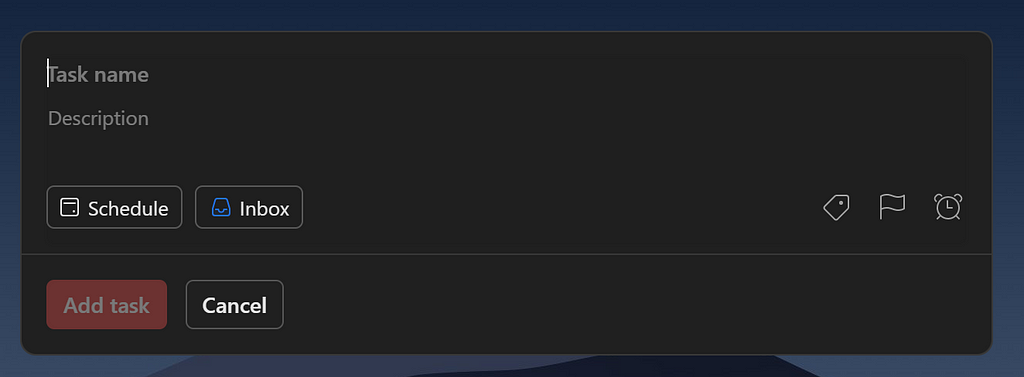
This is super powerful, since when you think of something you need to do you can immediately add it to Todoist without having to change windows or leave whatever you’re currently working on. In addition to tasks, I also use this to quickly write down stray thoughts or ideas that I have; I have a project called Scratch dedicated for this purpose. My other projects are: Productivity, Misc, Fun, Career, Coding, School, and org/company projects. Adding emojis makes the projects easier to identiy.
11.3 Notes / Knowledge Management
I used to use Notion to take notes, but now I primarily use Obsidian for my important note-taking. I made the switch after learning about conceptual notes, which has totally changed the way I think about my knowledge. I learned from this video which explains it quite well, but here’s my understanding of it:
Traditionally, we take sequential notes: we write things down in the order they’re presented to us in a class, and we bucket our information by class: my marketing notes are in one folder, and my statistics notes are in another folder. Within classes, we often break it down further by exam or unit: my notes for exam 1 or unit 1 are in this doc, exam 2 or unit 2 in another doc, and so on. Classes may be grouped into years or semesters as well; I have folders for each semester (Fall 2021, Spring 2021, etc). I use Notion for this style of note taking, and it works well when studying for exams or quizzes.
Unfortunately, sequential notes aren’t conducive to long-term retention of information. I’ve taken three statistics classes in college, and in every single one of them I’ve been taught Bayes Theorem. If I wanted to use my old notes on Bayes Theorem, I would have to remember what semester I took the other class in, then remember what exam or unit it was a part of, and dig through those notes to find it. This process takes a long time, so I just re-learn Bayes Theorem instead and have now done so 3 times.
Enter conceptual notes. Conceptual notes are just what they sound like; each note is an atomic concept, and it’s not stored in some nested list of folders, it’s another note in the large vault of my long-term knowledge. Bayes Theorem wouldn’t be a part of some larger “statistics notes” page, it’s now its own page that I can easily search for and add to if I encounter new information relating to it. Obsidian encourages this note structure, and allows you to easily search your notes, link related concepts together, and so much more.
The idea is that if you’ve learned something once, you shouldn’t have to learn it again — whether that means looking it up on google or digging through folders and long documents to find it. Once I’ve created a conceptual note, that concept becomes a part of my knowledge base. I can easily find it and view the understanding that I had of the concept when I first learned it.
Not everything I learn needs to be a part of my knowledge base; there are some classes that I take, like accounting, that I know I’m never going to use again. In that case, I just take sequential notes to get through the class. However, if it’s something that I might want to remember or use in the future, I add it as a conceptual note in my Obsidian vault. Obsidian and the Personal Knowledge Management (PKM) space is huge, and I’ve just scratched the surface in this guide. It does take a lot of effort to get started, so if you’re interested don’t hesitate to reach out! A lot of what I know about Obsidian comes from Bryan Jenks.
12. Conclusion
I hope you found some parts of this guide useful; I put a lot of time + effort into it and think it really would have helped me when I started my data science journey 2 years ago. If there’s any parts of this guide that you think can be improved or there was a section that really stood out to you, please let me know! I want to continue updating this guide, and it would be great to know that people are benefitting from it. You can reach me by email, ryan.brown@utexas.edu, or on LinkedIn here.
The Hitchhiker’s Guide to Data Science 🌌 was originally published in Towards Data Science on Medium, where people are continuing the conversation by highlighting and responding to this story.
from Towards Data Science - Medium https://ift.tt/3EWNBo1
via RiYo Analytics


No comments