https://ift.tt/3n8xJIW A guide to Choice-Based Conjoint Analysis For Product Development Photo by Atoms on Unsplash People spend a lo...
A guide to Choice-Based Conjoint Analysis For Product Development

People spend a lot of time making decisions about some of the products and services they purchase. In fact, A recent study showed that the average person spends about 130 hours a year just deciding where to eat. Generally, consumers make purchase decisions by making trade-offs between the various attributes of a product based on the utility it provides them. As marketers or product managers, it is crucial to understand how consumers make these trade-offs and what utility each attribute provides.
To understand the concepts of attributes and utility, let us consider the example of purchasing a new smartphone. The factors one might consider while deciding to purchase are the RAM, Storage Capacity, Camera Specifications, Screen size & Resolution, Brand, Price, etc. These considered factors are called attributes, and consumers derive some utility from each of these attributes. The utility gained from each attribute is also called a part-worth. Each consumer is different and could gain a different utility from an attribute of a product. For example, a photography enthusiast may gain more utility from the Camera Specifications attribute than from other attributes such as RAM and Storage Capacity. In contrast, A gaming enthusiast would gain more utility from the RAM, Storage Capacity, and Screen Size/Resolution. To develop successful products, marketers/product managers must understand the attribute preferences of their customer base and quantify the utility that customers gain from the attributes. Conjoint Analysis is a statistical method used to understand the relative importance/preference of attributes and quantify the utility a consumer gains from each attribute of a product. It can thus be used to model the trade-offs a consumer might make while making a purchase decision.
There are two fundamental assumptions we make while performing a Conjoint Analysis:
- Consumers purchase the product which gives them the highest total utility (sum of individual attribute utilities)
- Consumers follow a compensatory decision-making process. Simply speaking, this means that a positive attribute of a product can compensate for a negative attribute, i.e., customers are willing to make trade-offs.
Market Research Design
The first step in Conjoint Analysis is to design a market research study. Participants for the study are selected by Stratified Random Sampling to be representative of the population or target audience of the product.
Let us once again consider the example of purchasing a smartphone. (Product teams spend a significant amount of time brainstorming the attributes of a product and often conduct focus groups to get more insights from consumers) For the sake of simplicity, let us assume the only attributes are Ram, Storage, Camera, Screen, Brand, and Price.
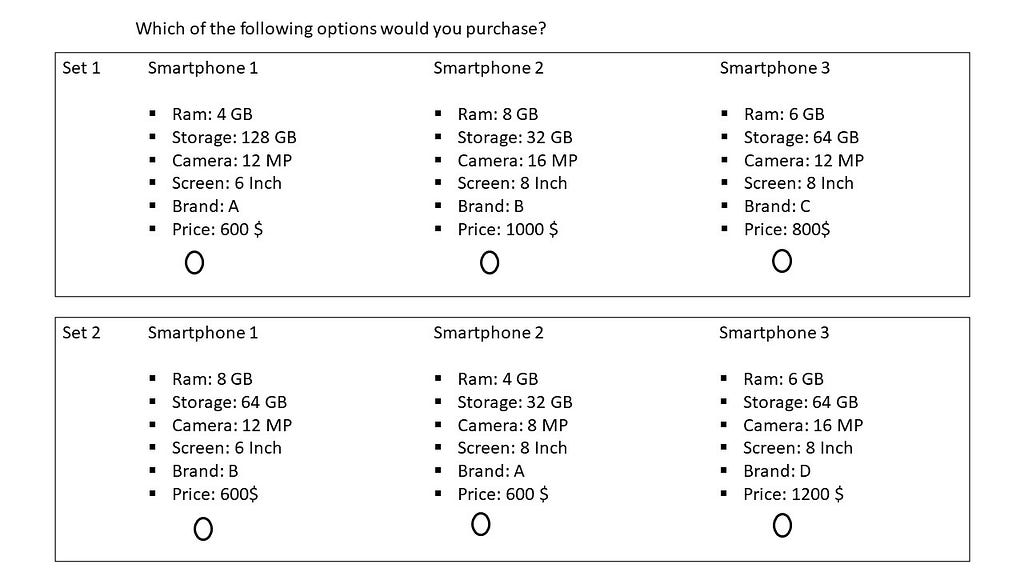
The questionnaire for this study is designed as shown below:

Participants of the study are given multiple choice sets and prompted to pick one option from each choice set. (I have only provided two random choice sets for the sake of simplicity. In an actual survey, participants are given anywhere between 10 and 20 choice sets based on the number of attributes of the product) The design of these choice sets is a complex task in itself, so I will not delve into that in this article. The questions are framed in the manner shown to simulate an actual decision-making process a consumer would go through. Each participant's response for each choice set is recorded and processed for modeling.
Statistical Model
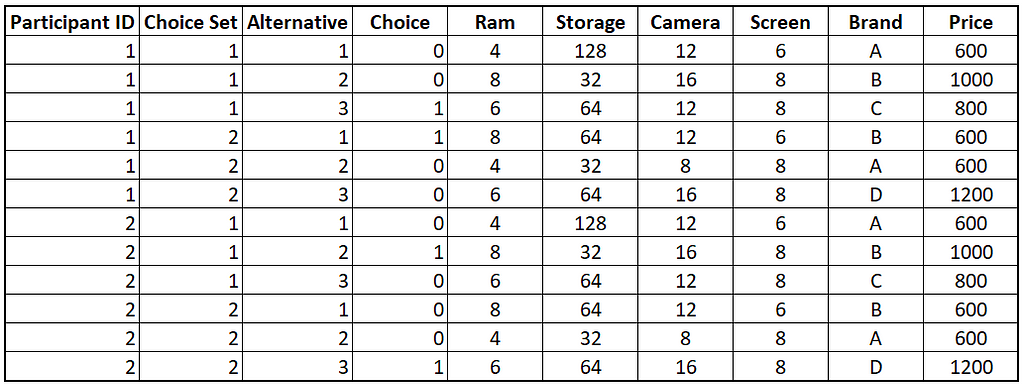
The response of each participant is recorded and processed. A sample of what the resulting dataset might look like is as shown below:

Before creating the model, we need to ensure that we correctly code the continuous and categorical variables. In this example, I will consider all the attributes except the 'Brand' as continuous. We then run a Logistic Regression with 'Choice' as the dependant variable and the attributes as the independent variables. It would also be useful to force the intercept to 0 for this model because when all the dependent variables are 0, there should technically be 0 utility for the product. This can be done in R using this code:
model <- glm(Choice ~ 0 + Ram + Storage + Camera + Screen + Brand + Price, Data = Data, Family = Binomial)
Model Results and Interpretation
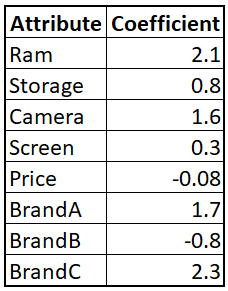
After we run the regression, we obtain the coefficients for each attribute. A sample of this is as shown below:

These coefficients can be interpreted as in a regular Logistic Regression. In this case, the log-odds that we model using Logistic Regression represent the utility the consumer gains from an attribute. So, A 1GB increase in 'RAM' results in a 2.1 unit increase in utility on average for our customers. Similarly, a 1$ increase in 'Price' results in a 0.08 unit decrease in utility on average for our customers. We also understand that customers value Brand 'C' more than Brands' A' and 'B'. (Brand 'D' is not included in the coefficients table as it is taken as the reference with coefficient 0)
Finally, we can calculate the total utility and probability of purchase for a product based on its attribute as shown below: (These results and calculations are based on random data that I created, not actual data. This might make some of the results seem illogical)

With the results of our model, we can test multiple specifications for the product attributes and arrive at the total utility and probability of purchase for our target customers. This is particularly useful when designing a new product to launch into the market.
Market Simulation
We can also use this method to simulate the market and estimate market share for a new product. Instead of running the Logistic Regression on the entire data of all the participants of the market research study, we run a Logistic Regression on each participant's responses. This gives us the total utility for a product and the probability of purchase for each participant in the sample. Since the sample is selected to be representative of the population, the results of the sample can be extrapolated to the entire population to arrive at an estimated market share. More complex methods such as Hierarchical Bayesian Models can also be used to arrive at more statistically significant results.
Conclusion
Conjoint Analysis is a powerful method to understand the product attributes that the consumers prefer in a particular environment. It can be used for designing a variety of products and even services. Professionally, I have used this method to understand the customers’ food preferences at a quick-service restaurant. It is also often used for Attribute-Based Pricing. While marketing decisions are a combination of art and science, this method is a powerful tool to remove subjectivity and personal biases while designing products or services. Needless to say, it is a method that will benefit every Marketing Analyst.
Modeling Consumer Decisions: Conjoint Analysis was originally published in Towards Data Science on Medium, where people are continuing the conversation by highlighting and responding to this story.
from Towards Data Science - Medium https://ift.tt/3HImHlq
via RiYo Analytics

No comments