https://ift.tt/3t5UEIN How combining research can offer a world of insights The word meta is Greek and means ‘after’ or ‘beyond’. So met...
How combining research can offer a world of insights
The word meta is Greek and means ‘after’ or ‘beyond’. So meta-analysis means after-analysis or beyond-analysis. Although this may sound strange, a meta-analysis is actually a method to:
- combine and analyze several trials.
- estimate a summary treatment effect.
- obtain a finding that is beyond the (single) effects found if you would have analyzed the data separately.
The word meta-analysis is a synonym for research synthesis. It combines the results of studies in order to come to a general conclusion. The more homogenous the studies are, the more explicit the conclusion is. A meta-analysis looks both at internal validity — is there an effect? — and external validity — to which part can this effect be generalized?. Perhaps the best way to describe a meta-analysis is to talk about apples, pears, and (rotten) fruit.
The sole goal of a meta-analysis is to compare apples and pears. However, if your studies are heterogeneous, you might end up with not only an apple or a pear, but also with a banana, an orange, and some grapes. Now, in such a situation, the comparison between apples and pears is severely compromised and the best you can do is to talk about fruit. If the studies themselves have serious methodological flaws, your are left with rotten fruit. Perhaps then it is best to not talk about anything at all, although such findings may actually be more interesting than a clear-cut meta-analysis.
The major reasons for conducting a meta-analysis are to:
- increase power when a single trial cannot provide a treatment effect due to limitations and / or heterogeneity, such as farms in agriculture.
- get an estimate of the variation in the treatment effect across farms / countries
- identify in which farms and countries our treatment shows the effect we want to see.
Hence, The goal of a meta-analysis is not simply to report the average treatment effect — it is to make sense of the patterns of effects. If the effect size is consistent across studies we need to know that and to consider the implications. If it varies we also need to know that and consider the implications. In the end, you will:
- combine different studies to demonstrate a treatment effect by increasing your sample size and statistical power.
- reduce the uncertainty often seen in small individual studies with a high type II error (false-negative results).
- obtain more confident conclusions in a wide range of experimental conditions (external validity).
However, in most research fields, a single well-powered Randomized Controlled Trial (RCT) is still believed to be sufficient for providing a reliable treatment estimate and change guidelines. In agriculture, we often expect the animals to represent the population which does not make sense having a study coming from a single farm. In addition, the design of a well-powered study can be challenging if not impossible by just using a single farm due to farm limitations. Furthermore, if we are interested in the treatment effect across farms, or even across countries, we to get a full sense of the external validity of the treatment.
Theoretically, to conduct a meta-analysis, you need AT LEAST two studies. Preferably, you include more and there is no upper limit. To be efficient, the included studies must have the exact same treatment. However, they do not have to have the exact same setting — sometimes we actually want different settings to increase external validity. Including various setting can have negative consequences — adding anything new is equal to adding variance which cannot always explained by a new setting alone.
The most important consideration in any meta-analysis is to determine which studies to include. A meta-analysis is strongest if at the very least the treatments included are exactly the same. In addition, you must identify IF there are trial factors that make the trials incomparable. All these considerations are up to the researcher, not the statistician. The key is to identify factors that will influence the treatment effect above and beyond what might be expected from random variation due to different farms or countries.
In short, your study design should reflect your aim of conducting a meta-analysis. This means that all included studies should have the same study design, the same treatments, and the same study protocols. Before starting the first study in a meta-analysis, a decent power calculation should be done, keeping the meta-analysis in mind
By now, it should be clear that conducting a sound meta-analysis requires making several choices, which are scientific and not statistical. Once you start analyzing, there is not much the algorithms can do to counteract your choice of including fruit instead of just apple's and pears. Hence, you need to identify potential influencers up front, during the design stage, and decide on their importance. Important questions that should arise in your mind are:
- will the treatment effect be less strong?
- will the treatment effect go to another direction?
- what is the possibility of limiting / deleting their influence in the design phase
- if I cannot limit their influence in the design phase, what is the possibility of limiting / deleting their influence in the analysis?
- if I cannot limit their influence and the influence is big, can I still include the study in the meta-analysis
Now, when we do arrive at the analysis stage, what is not immediately clear to most is that a meta-analysis is theoretically a Mixed Model:
- fixed effects → treatments
- random effects → studies (between variance)
- repeated effects → studies (within variance)
Hence, a meta-analysis looks at treatment effects over and across the variation between studies and can be described using a two-level mixed model including both within and between study variation. At the first level, the effect size estimate is just the effect size parameter plus random variation. If we combine all the effect size estimates, we get the mean effect size estimate. At the second level, the effect size parameter is determined by a mean effect size plus a study-specific random effect. The random effect represents between-study variation. The variation of the random effect describes the amount of variation across studies

Now, after the necessary introduction, lets get started. The coding for conducting a meta-analysis is surprisingly sparse BECAUSE all the important work for a meta-analysis has to be done BEFORE actually analyzing. Garbage in, garbage out.
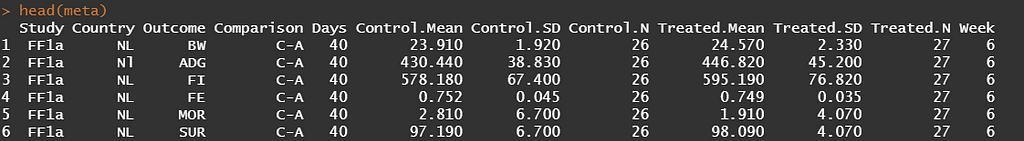
What happens now is that we will use the necessary metrics — mean, sd, N — to estimate the requested measure of interest. Here, we specify the mean difference between treatments. However, the metafor package allows many more metrics to be estimated.
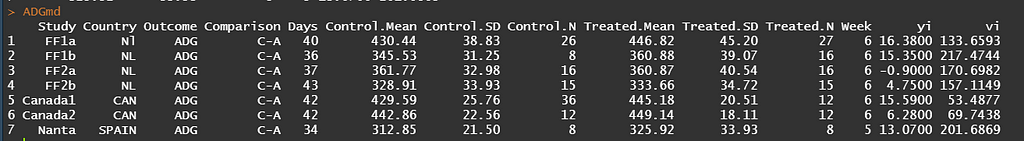
What happens now is that based on the input the algorithm will calculate — for each study separately — the mean difference (yi) and the sampling variance (vi).
These two metrics is all that the next algorithm — the Random-Effects-Meta-Analysis — needs to specify the treatment effects and variances, as well obtain an estimate of the overall treatment effect and between-study heterogeneity. Like I already said, it is a Mixed Model by nature so what will happen is that — on a study-level — a fixed treatment effect and a random study intercept is fitted. This will provide us with a global estimate of the treatment difference, an estimate of the variance between treatments (here called I2), and an estimate of the within study variation.
The codes down below request from metafor that for each outcome:
- a Random-Effects-Meta-Analysis is conducted
- an estimate of heterogneity is provided
- confidence intervals are provided
- results are shown using a forest plot.
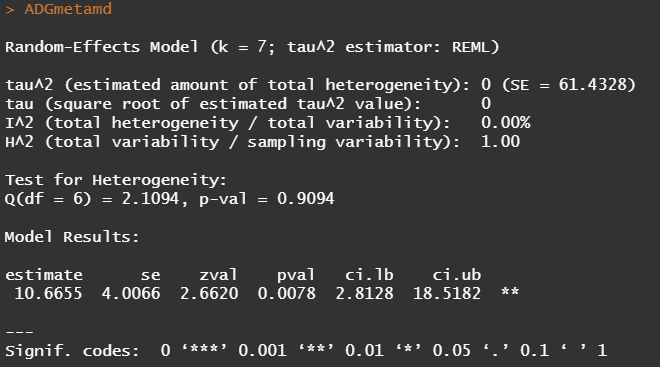
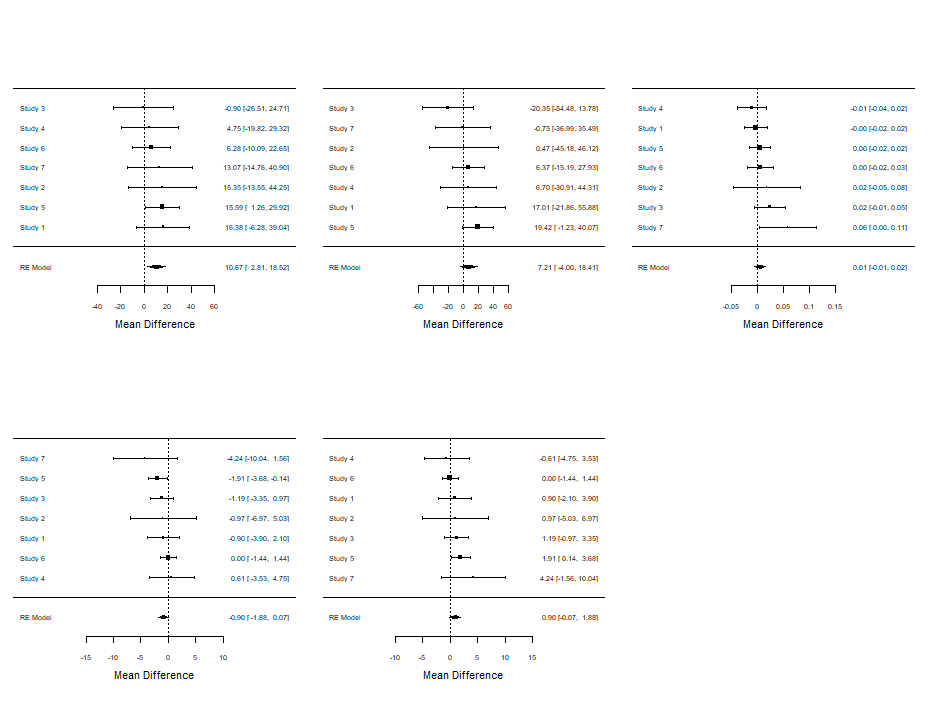
Below you see the results of the Random-Effects model. Seven studies in total are included and a first estimate shows little heterogeneity. This means we can be much more sure in ‘ trusting’ the provided comparison showing a significant difference between treatments.

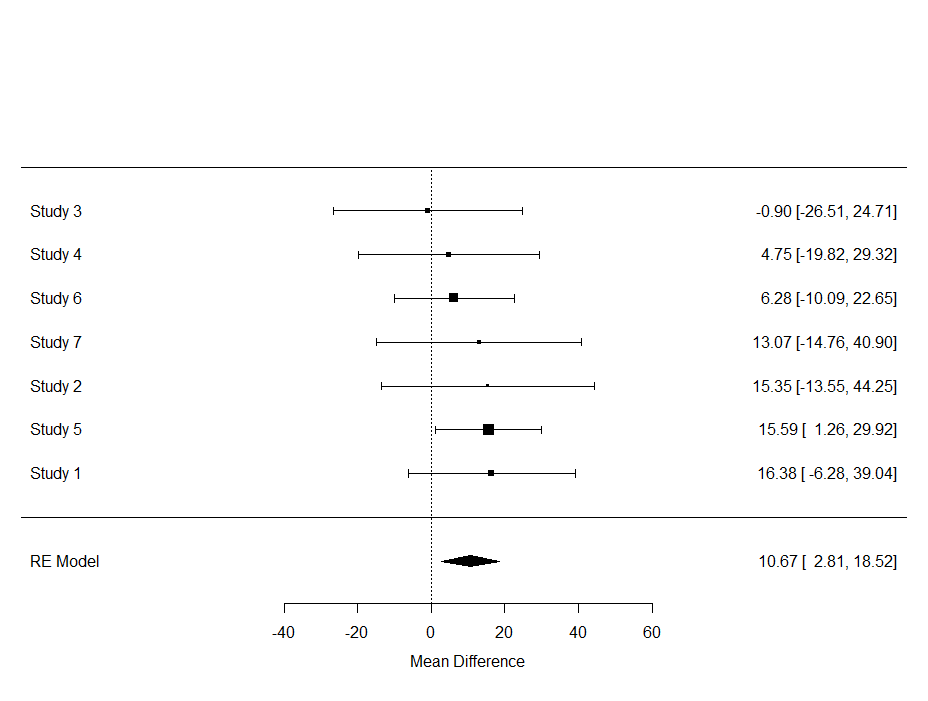
Although it is always great to look at metrics such as confidence intervals, the meta-analysis is truly best evaluated by its forest plot. Here, one can easily spot excessive within-and -between variance, and get a good sense of the validity of the summary estimate.
In the plot below, all point estimates except one — study 3 — show a similar effect. Their within variances differ, but the between variance is little to non-existent. Hence, we have — as already shown in the output — a homogenous batch.
What is most important to understand is what I had to explain — and still have to explain numerous times: studies that do NOT show statistical significance, CAN lead to a statistically significant summary estimate. The reason being that all studies estimates are pooled to obtain a better signal-to-noise ratio. If the studies had been too heterogenous, or did not show the same effect, the meta-analysis might actually do more harm than good.
A better plot can be provided by the following code structure.

Now, keep in mind that the danger of conducting a meta-analysis is hidden within the simplicity of what I just showed. When a meta-analysis shows a lot of heterogeneity, you must accept that the results are garbage and cannot be used. It is here that sub-group or sensitivity analysis might help you — as well as meta-regression — but these choices come with dangers of their own which I will address in a future post.
Don’t forget, a meta-analysis is a Mixed Model. Hence, all the assumptions that apply for a Mixed Model also apply here.
Introduction to Meta-Analysis in R was originally published in Towards Data Science on Medium, where people are continuing the conversation by highlighting and responding to this story.
from Towards Data Science - Medium https://ift.tt/3f3aZpc
via RiYo Analytics


ليست هناك تعليقات