https://ift.tt/3sUiLdr Garbage Route Optimization Using Computer Vision Object Detection Co-written by my 10 year-old daughter, Isabella, ...
Garbage Route Optimization Using Computer Vision Object Detection
Co-written by my 10 year-old daughter, Isabella, whose science fair project turned into her first, hands-on machine learning project
The following is an edited version of my daughter’s final report for her fifth grade science fair. We worked on this together, a few weekends at a time, for two months. Personally, it was an extremely rewarding opportunity to teach her (what little I know) about computer vision and coding in Python.
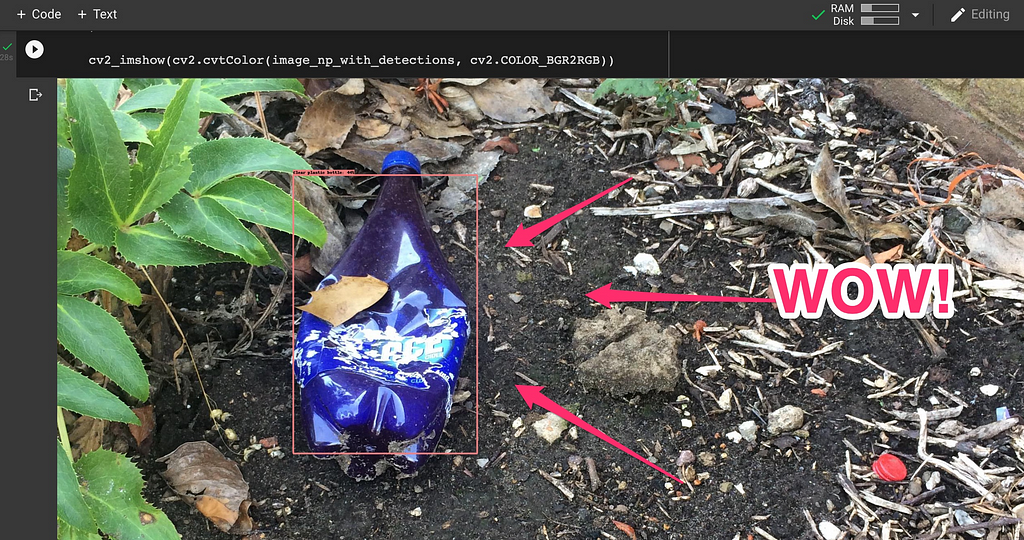
She was hooked from the moment she executed her first Colab cell 2+2 — only to see that evolve into a fully fledged system that could detect garbage in images:
I look forward to working on more projects with the next generation of AI engineers!
Problem Motivation
I am troubled by how much trash I see in my city. It is important to keep our streets clean because litter can leech into our soil and water supplies. Such environmental impact is terrible to our health –– not to mention the fauna and flora. As if that weren’t enough, the natural beauty of our landscapes are significantly diminished by litter.
To drive awareness for this problem, I hypothesized that city councils need good data to (1) confirm the problem exists in their districts, and (2) identify what areas need the most trash collection resources. To solve the problem, I envisioned a camera mounted on city vehicles (police cruisers, garbage trucks, etc.) that passively collects video data as the vehicle performs its daily civic duty. Then, the camera data is processed by a computer vision system that can automatically detect trash in the camera’s view. Lastly, I imagined offering a data product (such as a heat map) to city councils.
Armed with such a system, I believe that cities would take targeted action on the areas that need the most help.
Blueprints
I began my project by brainstorming multiple solutions to the problem. In one solution, I imagined a simple, non-technical implementation:
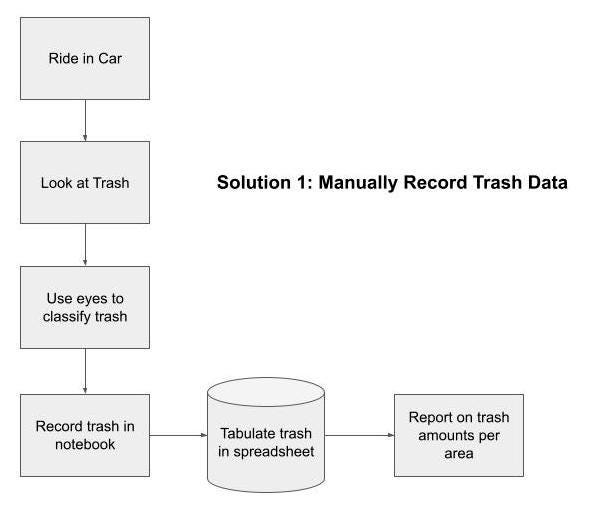
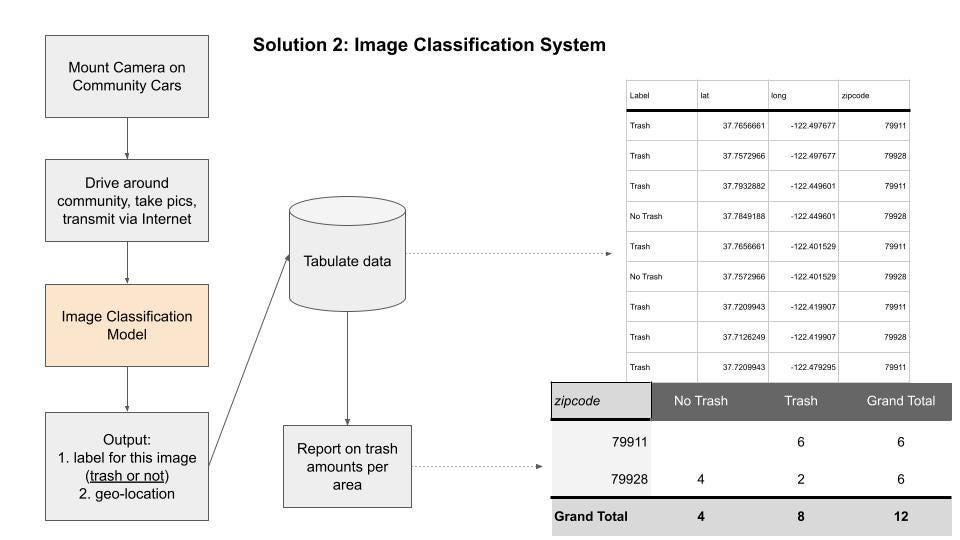
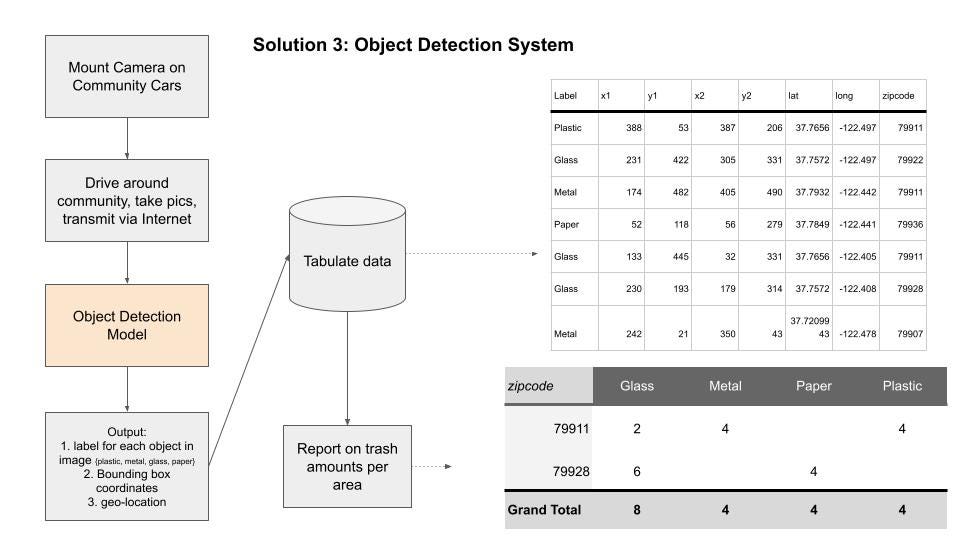
Solution 1 had many limitations. Namely, it is not scalable. No city would task its workers to eyeball trash on every street, every day. Thus I considered “Solution 2”, which leverages machine learning to classify images from a camera feed. That solution was attractive because it is doable and cost-effective with commercial-off-the-shelf components. Solution 2 has two important limitations: it cannot identify multiple trash items nor can it identify different kinds of trash. Thus, I considered “Solution 3”, an object detection system that is trained to identify multiple trash types per image.
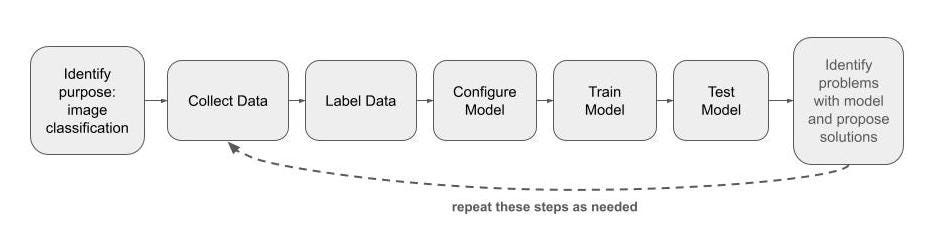
Here is a blueprint for how I sought to prepare and use my machine learning model:
Building
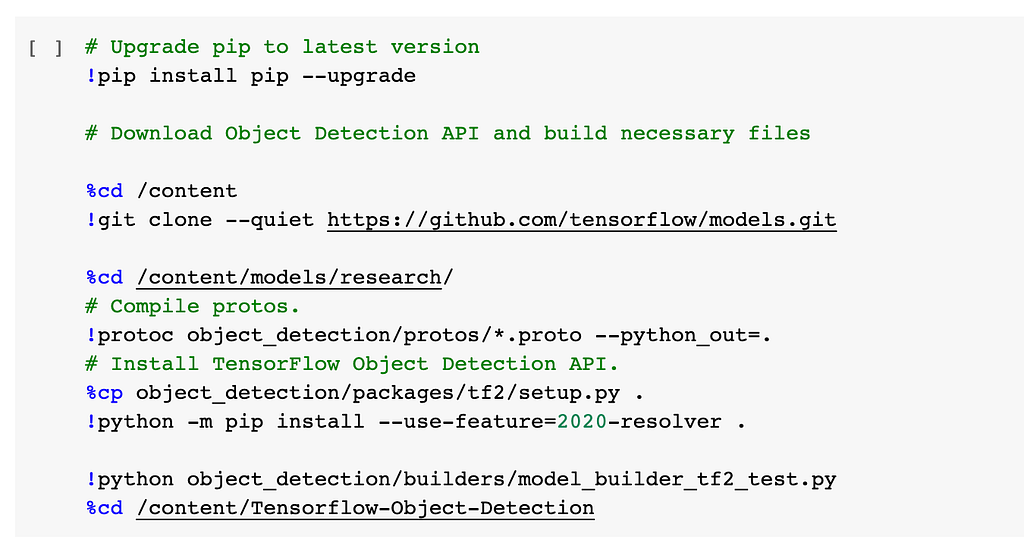
The following excerpts are from my Google Colab Notebook.
First, I installed the Tensorflow Object Detection library in Colab.
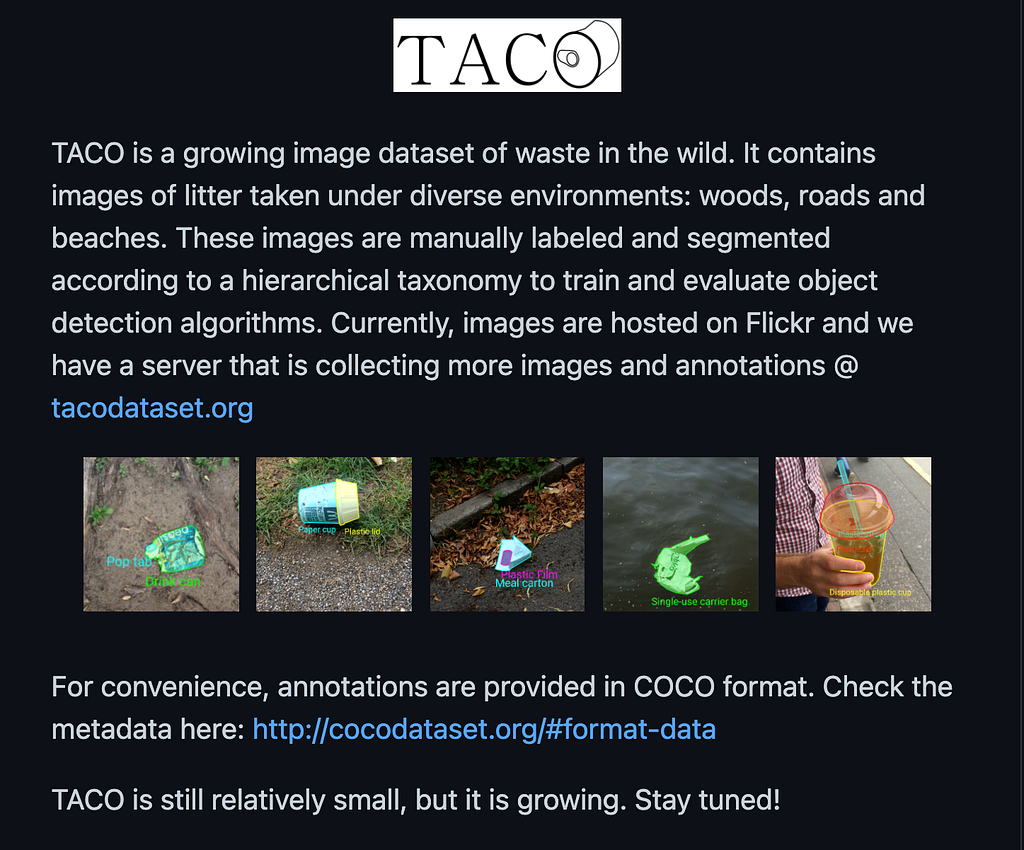
Then I downloaded the TACO dataset, which contained thousands of labeled trash images in COCO format.
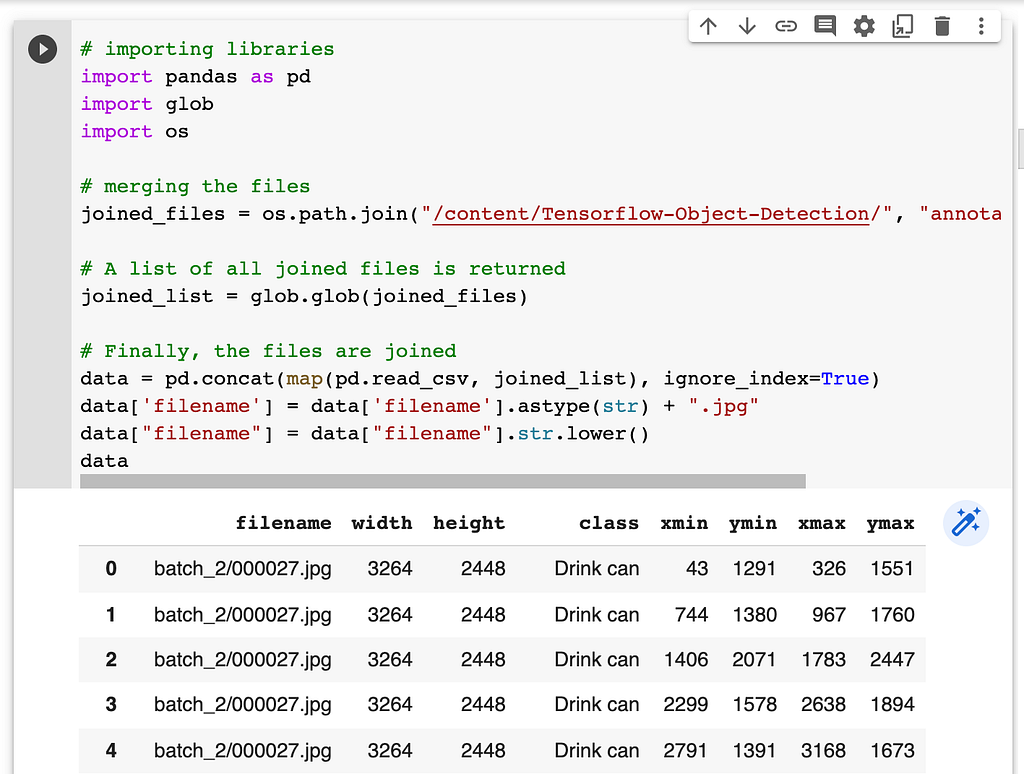
Next, I converted the COCO data format from XML to CSV format appropriate for Tensorflow object detectors. Then I created a data frame that contains the filename, class (‘Trash’), and bounding box coordinates.
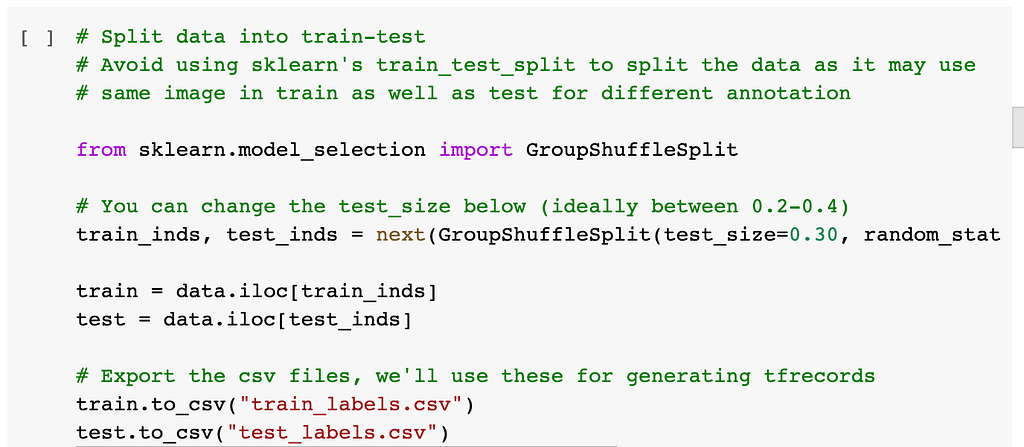
Then I created a data shuffle and split to randomly assign images into train, test, and validate groups.
I configured an efficientDet_d0_512x512 object detector from the TensorFlow library that has pre-trained weights. This helps cut down on training time because the model already has some of the base layers configured to detect various objects. The task here is to ‘fine tune’ that base model with examples of trash so that it learns to detect my examples as well.
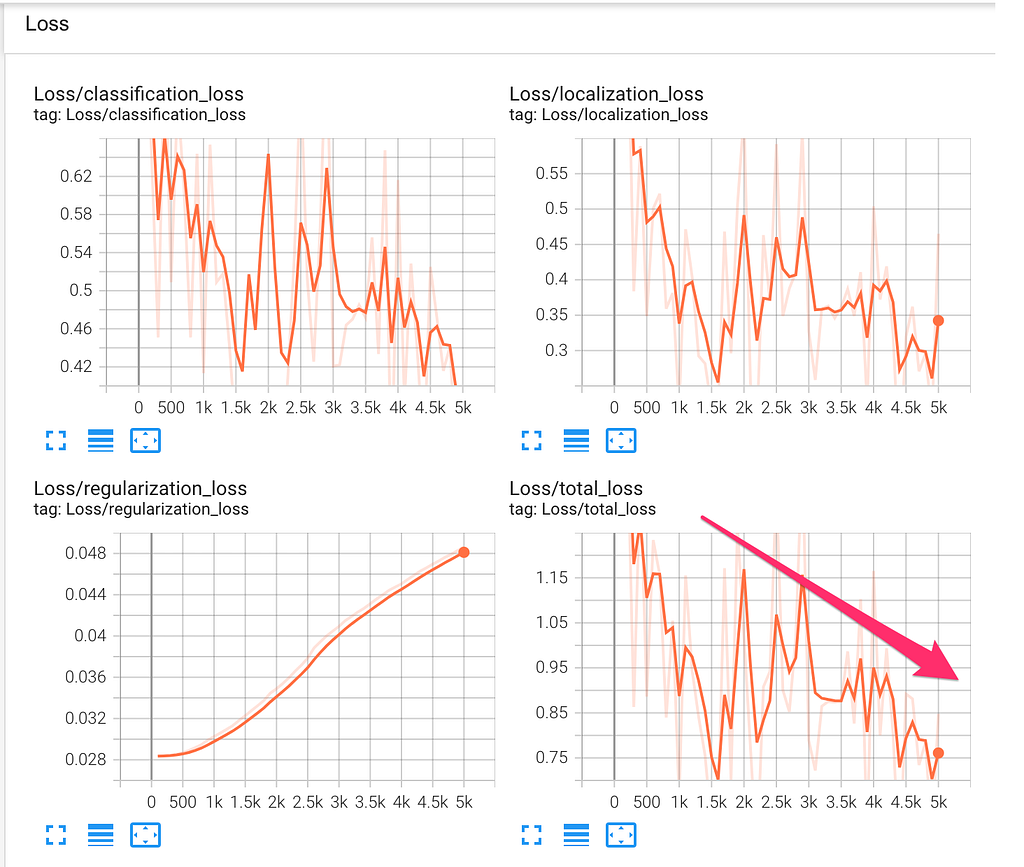
I then trained the model and observed its total_loss function to determine that it was training properly. Note the decreasing loss function as the model continues to run through training iterations.
I exported the model weights so that they can be reloaded at a later date as needed. This is important because otherwise I would have to retrain the model each time I wanted to run object detection inferences, which is not good because it took 1.5 hours to finish training this model.
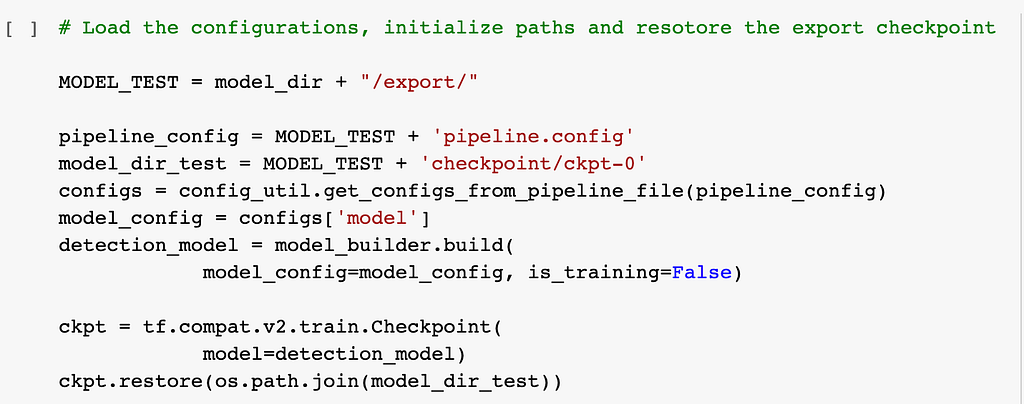
I also confirmed that I could reliably reload my exported model as follows:
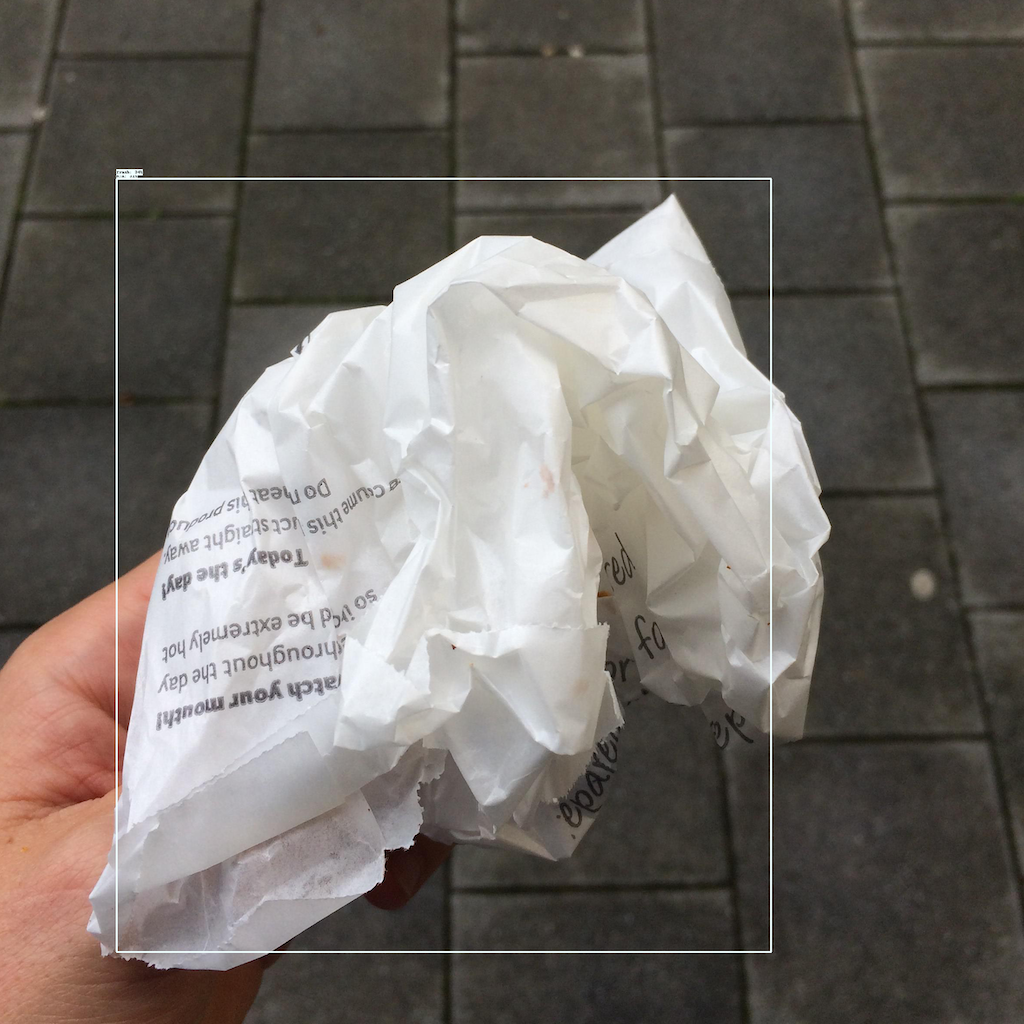
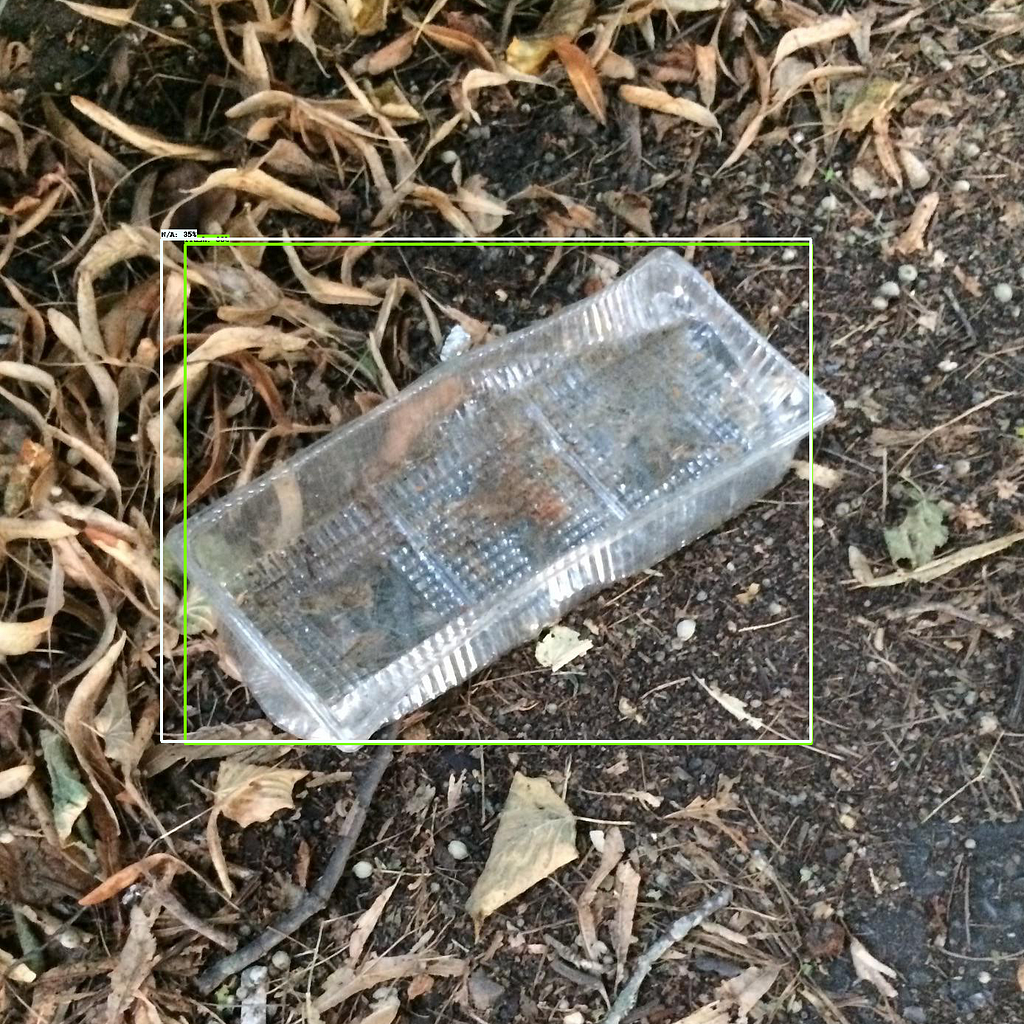
Eager to see my results, I used a script that would take a new picture the model had never seen to visualize its performance:
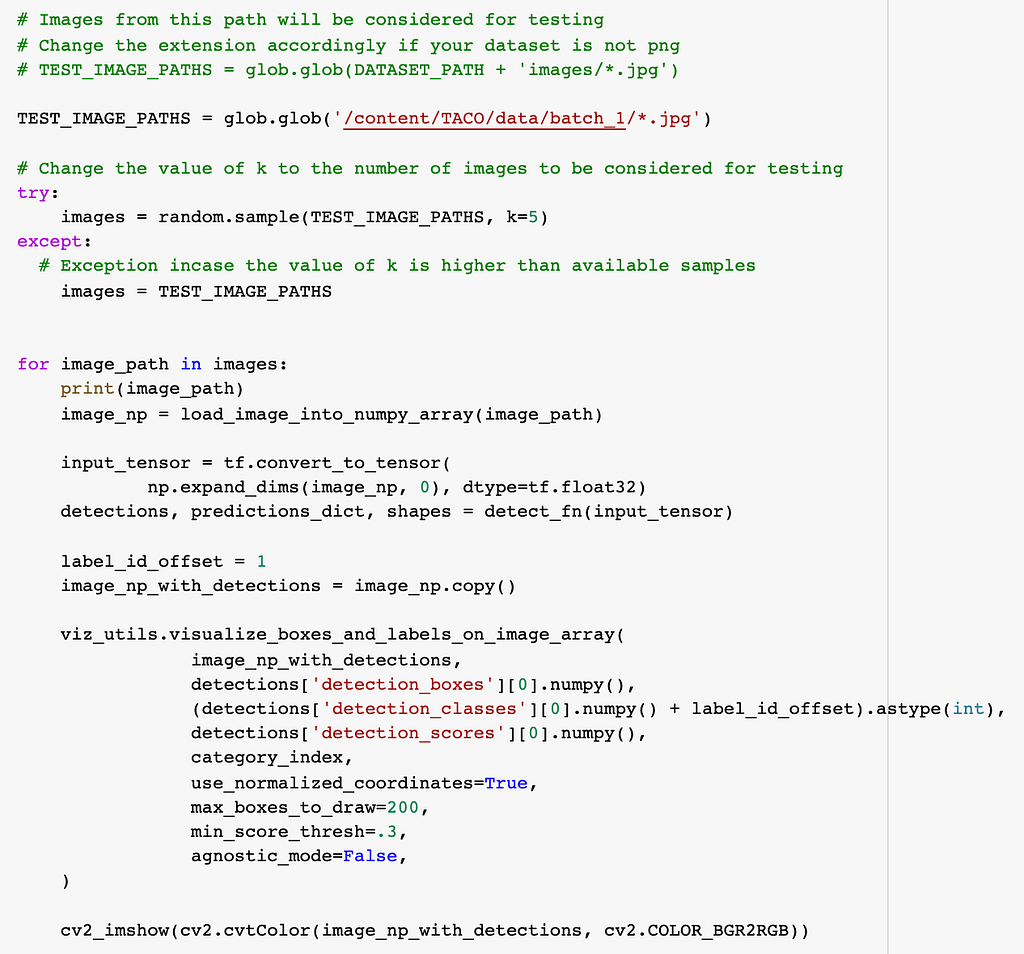
Here are some example outputs from this step:

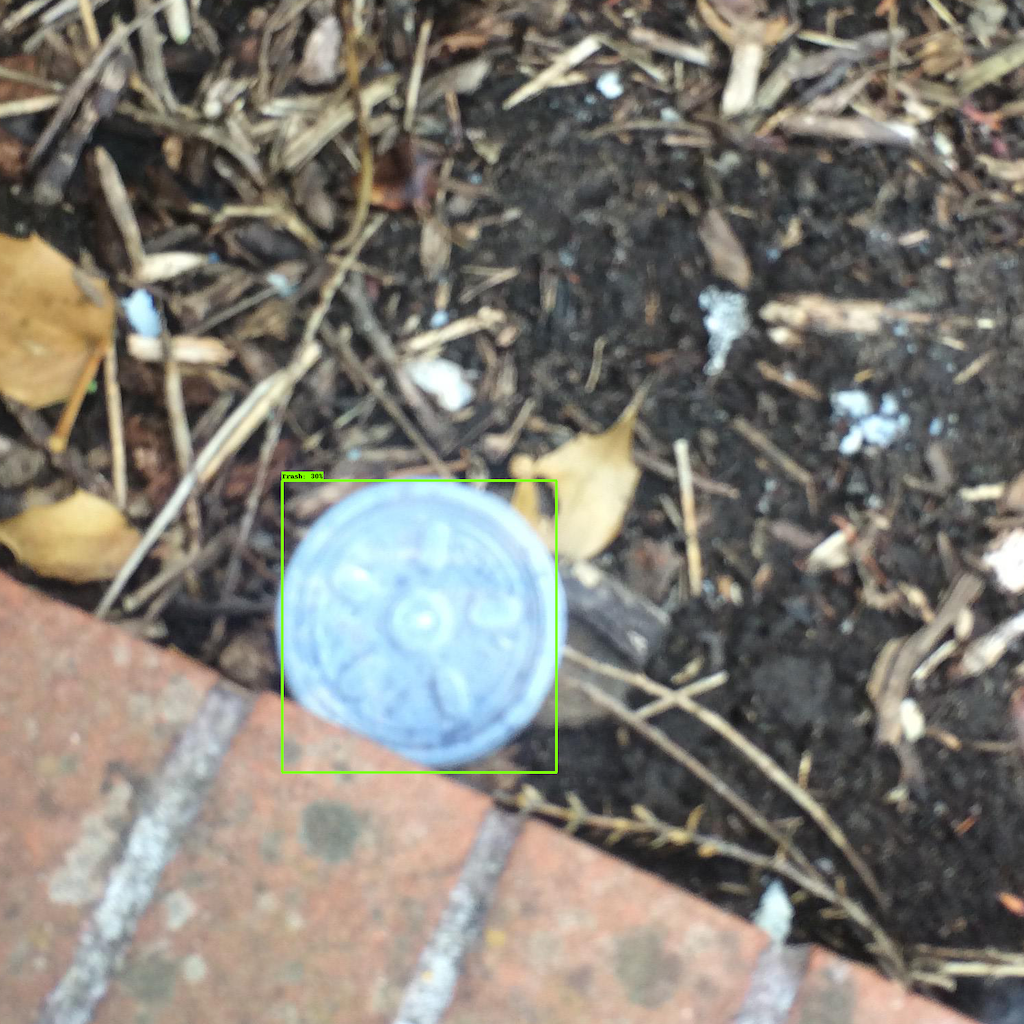
With the model complete, I turned my attention to extracting latitude and longitude from the pictures’ EXIF metadata. I successfully performed that with this script:
On another day, I got in the backseat of my dad’s car and he drove around various neighborhoods in El Paso, TX while I snapped pictures from my iPad. Those pictures included geo-location data that I could extract using the script above.
After taking all of the pictures, we connected the iPad to a computer and downloaded the images. Later, we uploaded those images into the Colab environment in a “custom_data” folder.
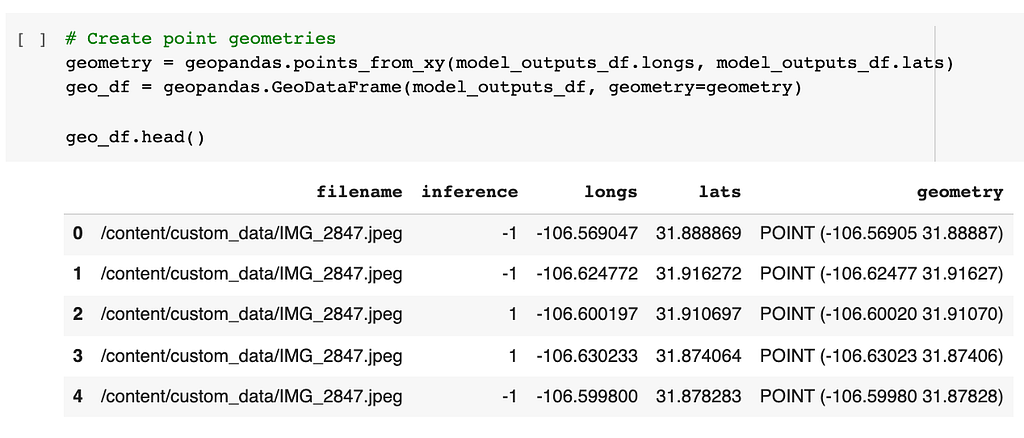
For each image in the custom_data folder, the following script (1) performed an object detection inference, (2) extracted latitude/longitude, (3) stored the data together in a dataframe (table).
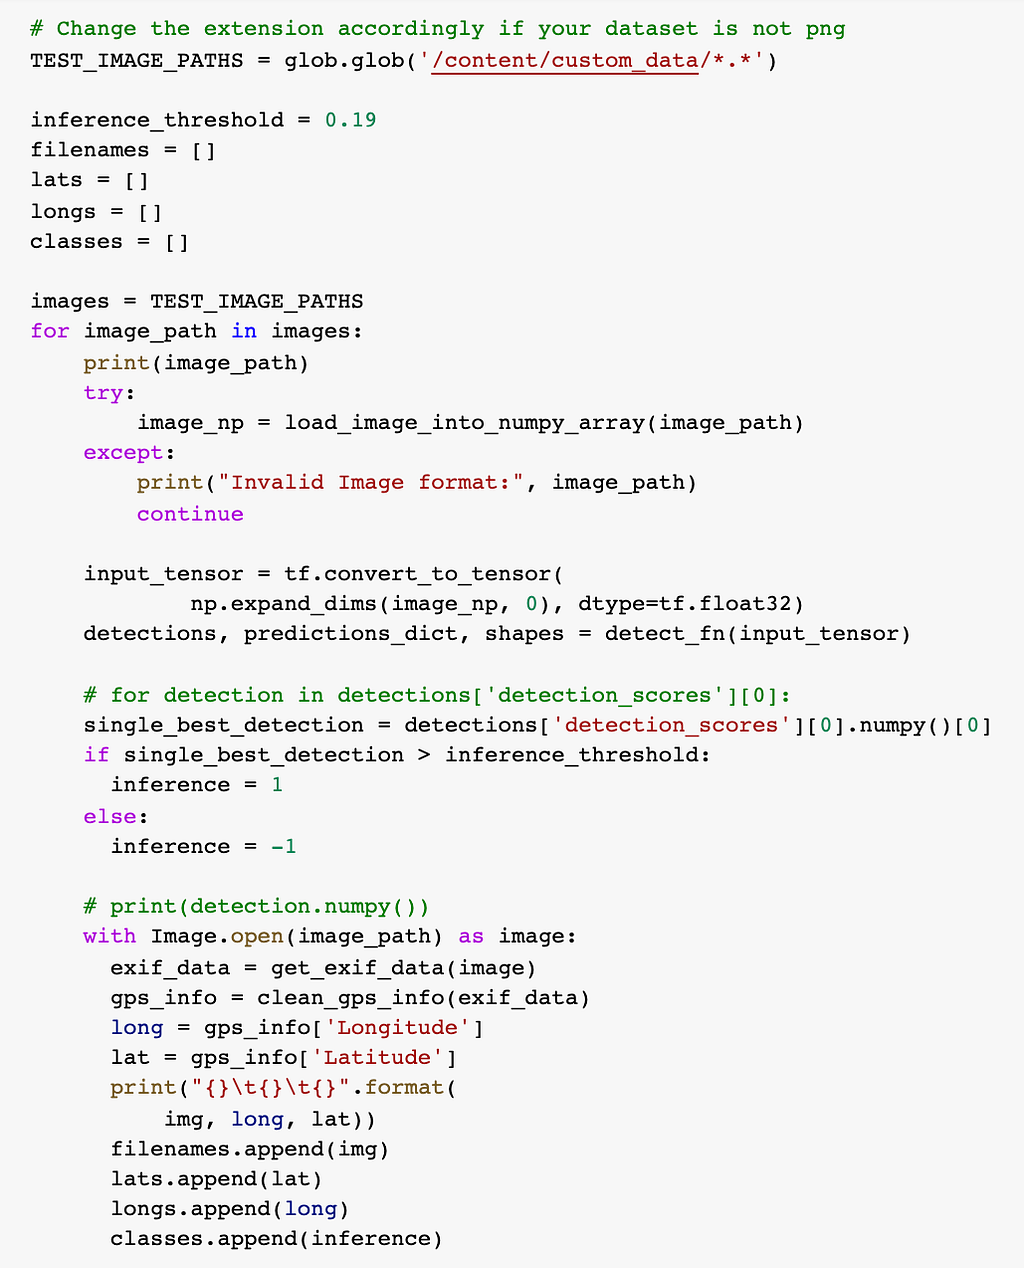
Here is an example of the output:
Next, I installed the Folium plugin for GeoPandas, which offers a heat map function:
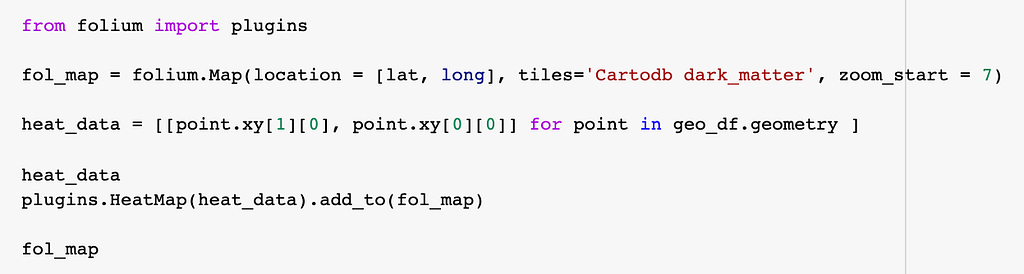
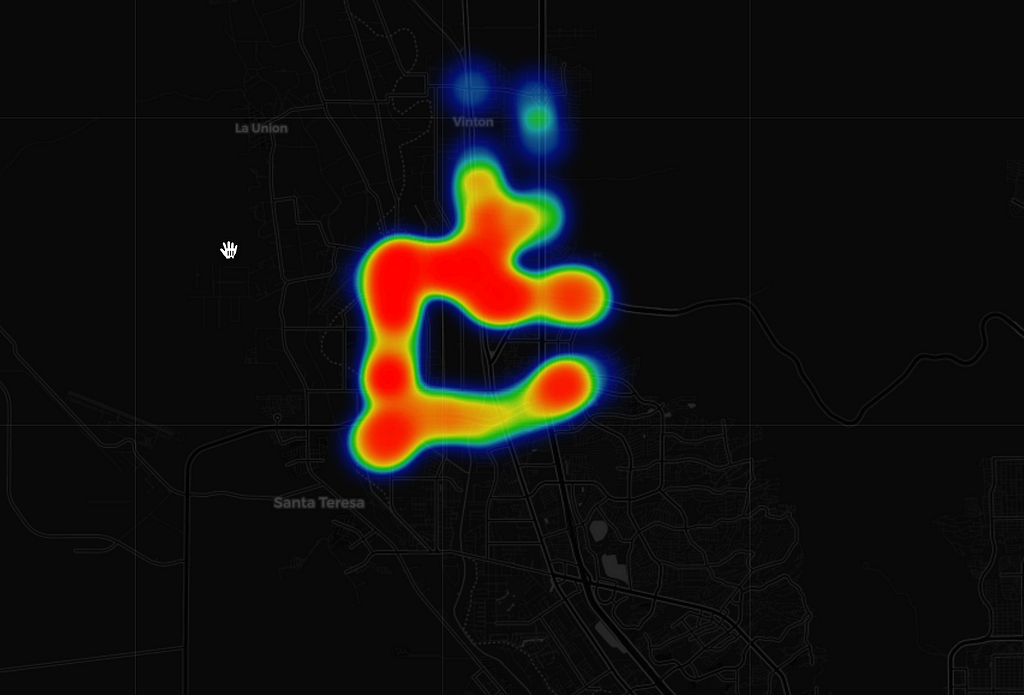
Feeding the dataframe from the script above created an interactive heat map, showing areas with more or less trash. Here are some heat map screenshots of different areas in El Paso, TX:
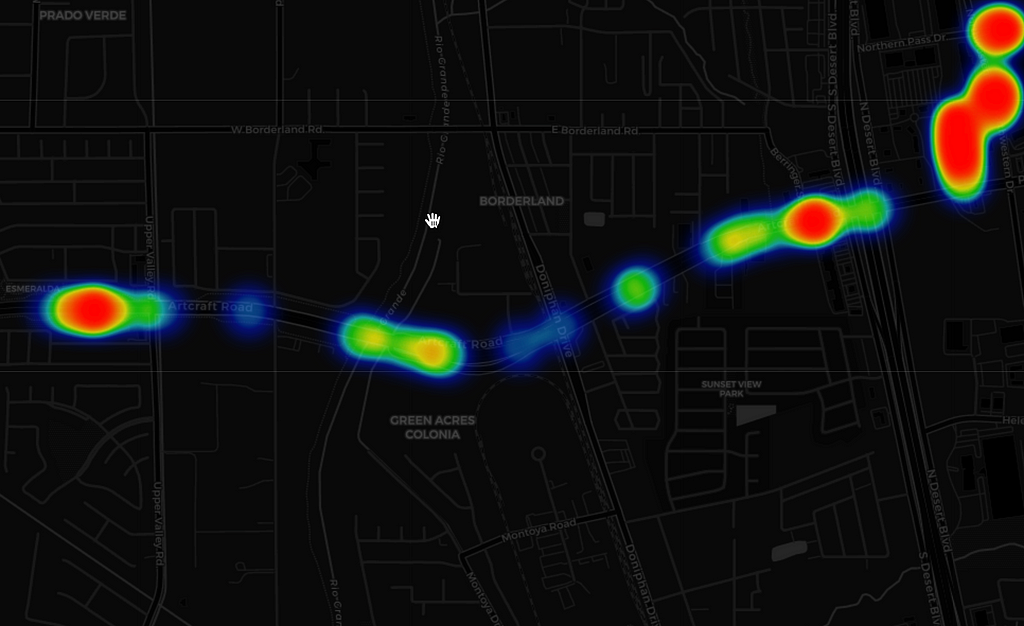
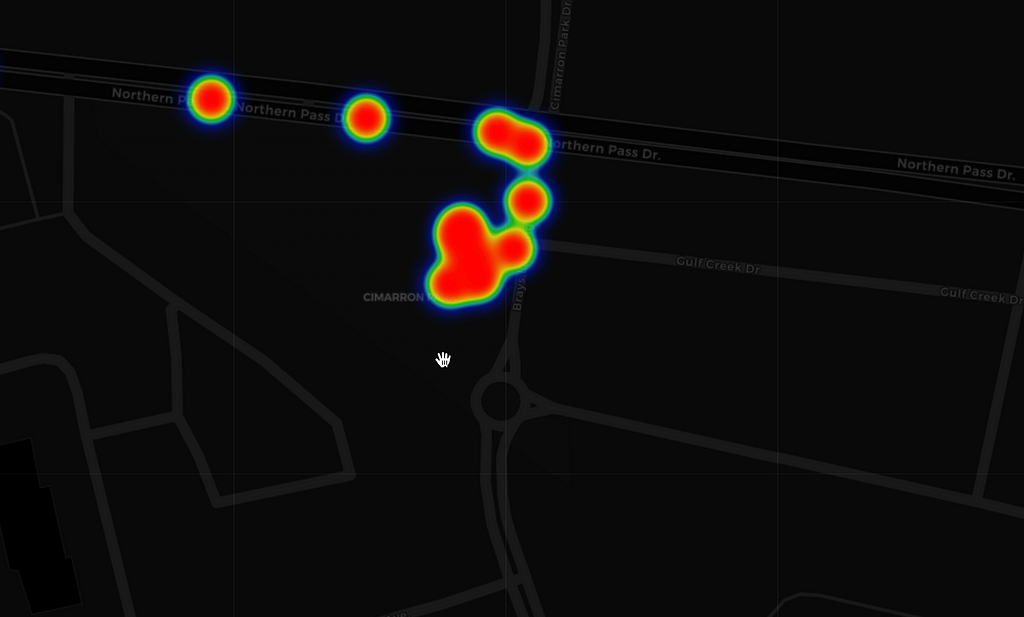
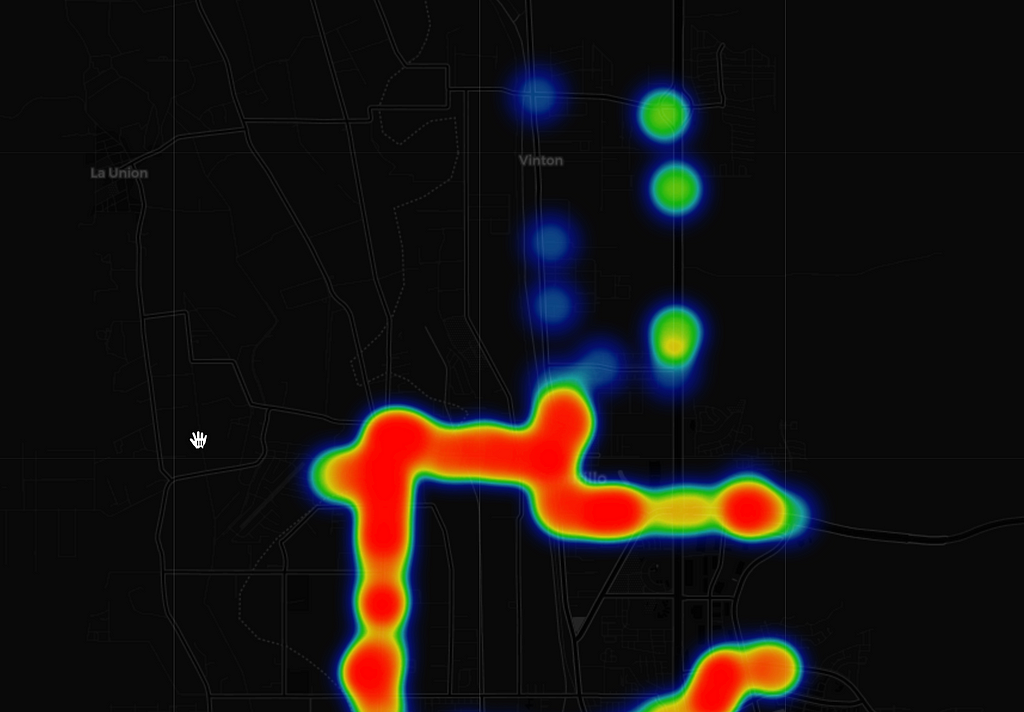
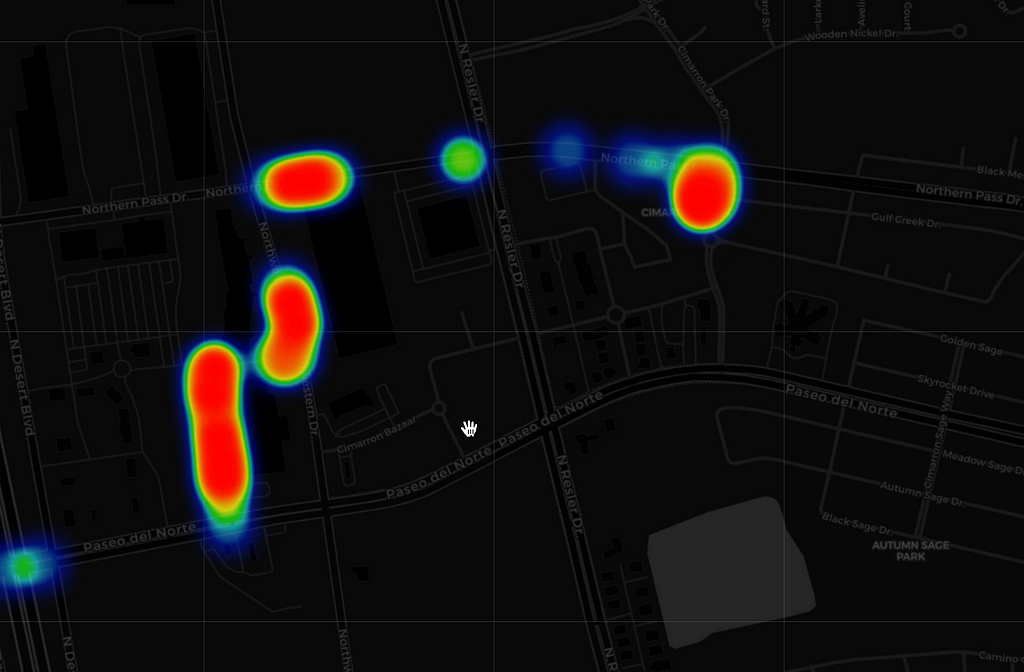
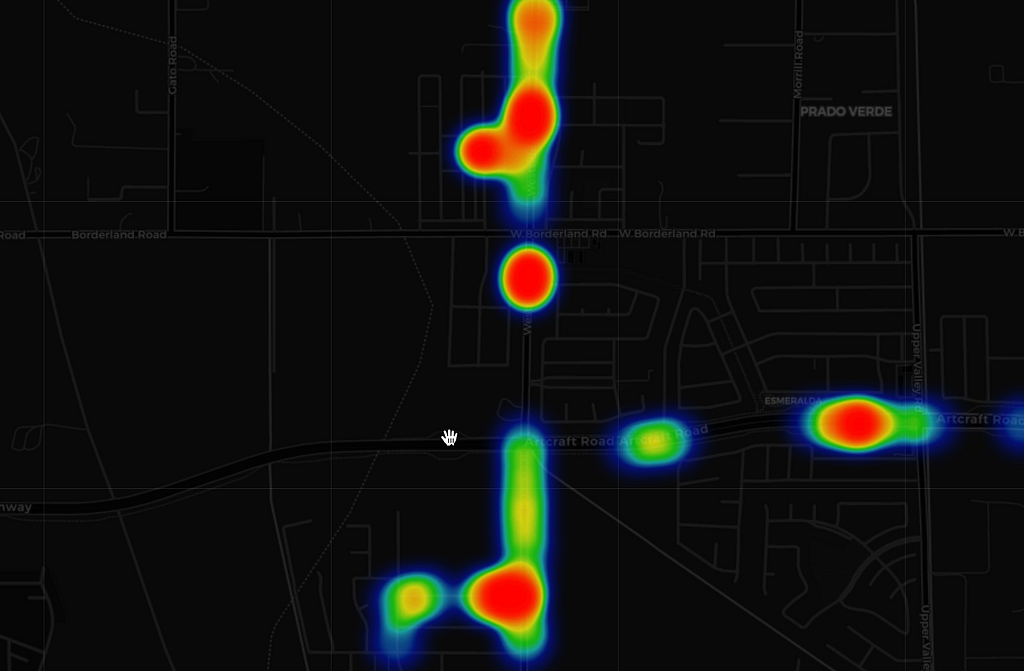
Reviewing the data, I made some important observations. First, the Wal-Mart parking lot was surprisingly clean. I had hypothesized that it would be very dirty because of the volume of people and cars. Upon reflection, however, I believe that it is a clean area because the business has an interest in creating a welcoming shopping environment and thus cleans the parking lot regularly. Second, I had hypothesized that areas near the highway, Interstate-10, would be dirty due to the amount of traffic. My data supports that conclusion, and the city of El Paso should allocate more resources cleaning that area. Third, the farming area (aka “Upper Valley”) was surprisingly dirty. I had conjectured that fewer homes and people would have led to less trash. Quite the opposite.
Conclusion
In conclusion, this was a great project to learn more about Python, machine learning, and object detection — all in the context of doing good for a city! This was a good solution to the original problem, because it would be too time consuming for people to perform such analytics without automation. My proposed solution is a cost-effective way to quickly identify areas with significant trash in a city. I can imagine configuring my system on city vehicles so they regularly collect this data while performing their other daily tasks.
Next time, I would do some things differently. For example, I would try to create a more balanced sampling method for taking pictures of the city. I’m concerned that I was so eager to find pictures of trash, and in doing so I likely oversampled trash in my data (bias). I remember that in one park I could see many pieces of litter and I specifically ran up to them and took pictures.
As for improving my design, I would make two important changes. First, I would find a way to deal with the issue of over-counting trash when the same piece of litter appears in multiple pictures. This happened when the car was moving slowly and I took a sequence of pictures quickly, thereby including the litter in the first half of the frame in one picture and the second half of the frame in the second picture. In that scenario, the same trash gets counted twice in a specific area. One way to improve this design is to create a geo-filter that only takes one example per a geographic radius. For instance, even if 10 pictures were taken at the same latitude/longitude, then one should be considered for analysis only.
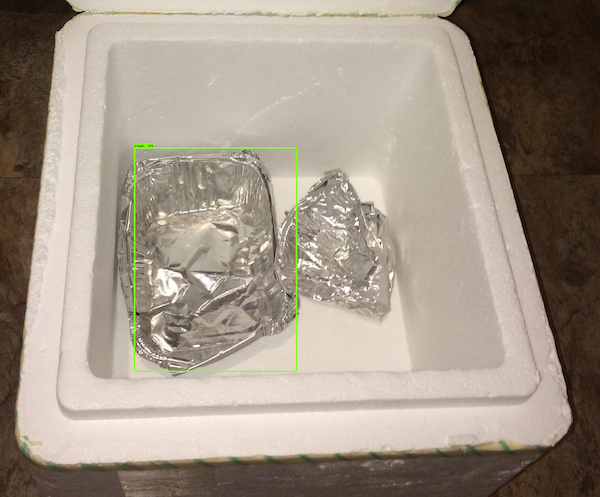
Second, the model would sometimes identify the same trash item as multiple inferences in the prediction array. Here is one example:
Future improvements include processing inference to determine if one bounding box is substantially within another inference bounding box, such that I take the results from only one of many similar predictions. Here, to make the project tractable within my allotted time, I took the most probable object detection inference in the array of predictions. By way of example, my system identifies and plots only one item in the heat map even if the object detector could find both (see image below). This led to undercounting of trash in especially dirty areas.
Third, my first trained model used the TACO dataset with 60+ classes (aluminum foil, aerosol cans, wrappers, etc.). But I hypothesized that I did not have enough training data to accurately capture so many different classes in a case where I was fine-tuning an existing model. Instead, I used a script that converted all trash classes into one superclass called “Trash.” In this way, I could train the object detector with approximately 2,400 diverse examples of trash. That change improved my model’s ability to consistently detect trash in the uploaded images.
My thinking evolved throughout this project. At the beginning, I wanted to build an object detector model because it could count multiple pieces of trash per image and report on different types of trash (aluminum, paper, glass, etc.). But I ran into a few challenges, such as (1) realizing that the model was counting the same trash multiple times when it appeared in various images, and (2) classifying the same item multiple times with different levels of accuracy. To solve those problems, my design had to change. First, I ended up creating an object detector with a single class (“Trash”) and counting only one instance of trash per image. In retrospect, I should have used an image classifier instead. I suspect that would have been faster to train.
This project should help others who want to extend my work. I hope cities around the world implement this project one day. In doing so, they can identify the dirtiest areas and optimize garbage collection efforts. I genuinely enjoy helping Earth and coding. This project was the perfect way for me to combine those passions.
—
Big thanks to Pedro Proença and Pedro Simões for open sourcing their project, TACO: Trash Annotations in Context for Litter Detection, which made this work possible.
The training, test, and validation dataset used herein is under an MIT License and available on GitHub at https://github.com/pedropro/TACO. The data used to create the heat map visualizations were images taken by the author.
Garbage Route Optimization Using Computer Vision Object Detection was originally published in Towards Data Science on Medium, where people are continuing the conversation by highlighting and responding to this story.
from Towards Data Science - Medium https://ift.tt/3Hycubm
via RiYo Analytics


No comments