https://ift.tt/jAD7c8Jqs The silent error that might be ruining your machine learning project Photo by Sasikan Ulevik on Unsplash Wit...
The silent error that might be ruining your machine learning project

With Data Scientist consistently named the Sexiest Job of the 21st Century, it’s no surprise that many are flocking to learn skills like Python, mathematics, and machine learning through university degree programs or online boot camps. These programs can be great to learn the basics but are often quite disconnected from the best practices and realities of implementing machine learning in the industry. One topic that is often lacking from these programs is data leakage, i.e., when your machine learning model knows too much. Data leakage is extremely easy to accidentally introduce into your machine learning project and can have serious consequences.
In this article, we’ll cover
- What is data leakage?
- How does a machine learning model learn?
- Examples of data leakage and how to prevent them
- Best practices for preventing data leakage
What is Data Leakage?
Imagine the following scenario. You’ve spent a couple of weeks building a machine learning model with extremely high precision and recall. You’re super excited, so you deploy your model to production and let it begin to make predictions on live data only to find out your model is making all of the wrong predictions! This ultimately leads to frustrated users and an angry boss knocking at your door. Unbeknownst to you, data leakage may be the culprit of your model’s poor performance in production.
In the machine learning world, data leakage, also known as target leakage, can occur in two different scenarios:
- Your training data includes information about your test set
- Your model was trained on information that’s not available when it goes into production
Before we walk through a few examples of data leakage, let’s cover the basics of how a machine learning model learns.
How Does a Machine Learning Model Learn?
If you’ve been practicing machine learning for years, you can skip this section. But for anyone newer to machine learning, to train a model, you take all of your available data and split it into two sets — your training set and your test set.
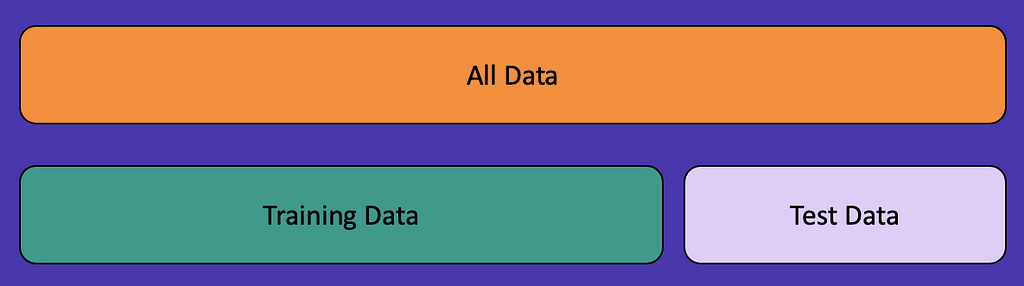
You will train your model on the training set and then verify your results on the test set. There are many ways to split your data into these two sets, but one of the most popular methods is called a random train/test split. This is often what you will use in academia, but we’ll walk through a couple of examples where this method can introduce data leakage.
Let’s see an example of a random train/test split.

Here we have some example data of movie names along with their genres. If we wanted to do a random train/test split on this data, we would first decide how much data we want in our training and test sets. There are many ways to do this, but let’s say we choose a 60/40 split, meaning that 60% of our data is in our training set and 40% of our data is in our test set.
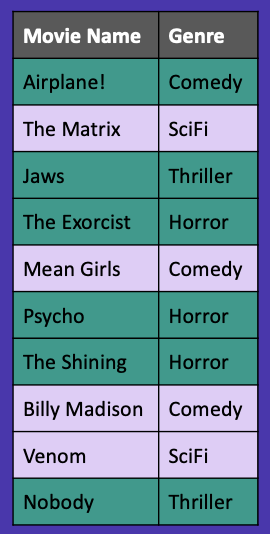
In Figure 3, you’ll see we’ve randomly selected six data points for our training set denoted in dark green and four data points for our test set denoted in purple.
Example #1 — Don’t Randomly Split Time Series Data
Now that we know how a machine learning model learns and what a random train/test split is, let's walk through our first example of data leakage.
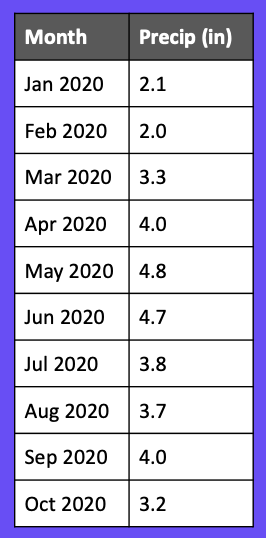
Here we have the number of inches of precipitation for several months in 2020. Let’s say we’re ready to train a model to predict how many inches of precipitation will occur in a given month. You might be tempted to use the random train/test split we covered above, but that would introduce data leakage! Let’s see why.
If we split our data randomly using a 60/40 train/test split, it might look something like this.
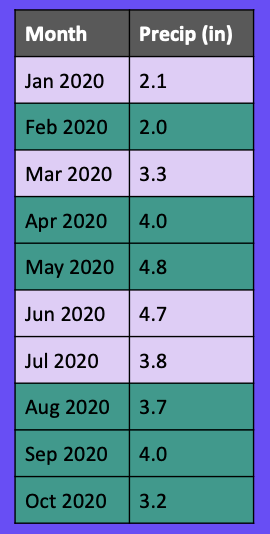
Let’s say we want to predict how many inches of precipitation we will receive in July. When we go to make this prediction, we’ve already trained our model on August, September, and October’s precipitation, so the model knows what will happen in future months!
Instead of using a random train/test split, we want to use a sliding window. There are several different ways to use sliding windows in time series data, but we’ll just cover one example here.
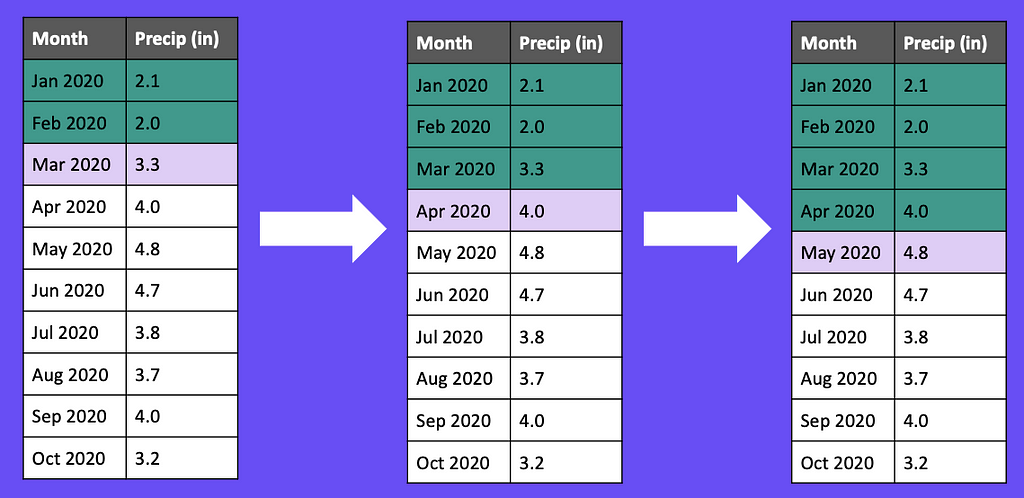
In Figure 6, we first train our model on January and February data, and then use that data to predict March. In our next iteration, we’ll add March to our training set and use January, February, and March to predict April. We repeat this cycle for a set number of iterations and then ultimately aggregate the errors from each iteration into a single error metric.
Pro tip: Always use a sliding window to split time series data!
Example #2 — Don’t Include Data From the Future
Let’s extend the previous example by adding more data to try and improve our model. In Figure 7, we’ve added in the high temperature for each month.
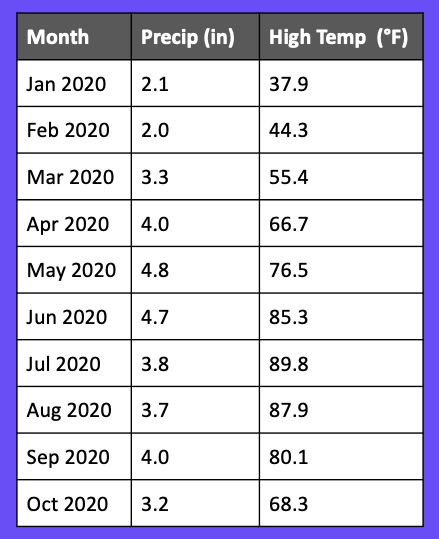
This seems innocent enough, but it’s a source of data leakage if we include it in our model. If we try to make a prediction at the beginning of the month, our model won’t have the high temperature for the month because the month hasn’t been completed yet!
To prevent this from happening, we recommend that you map events related to your data onto a timeline.
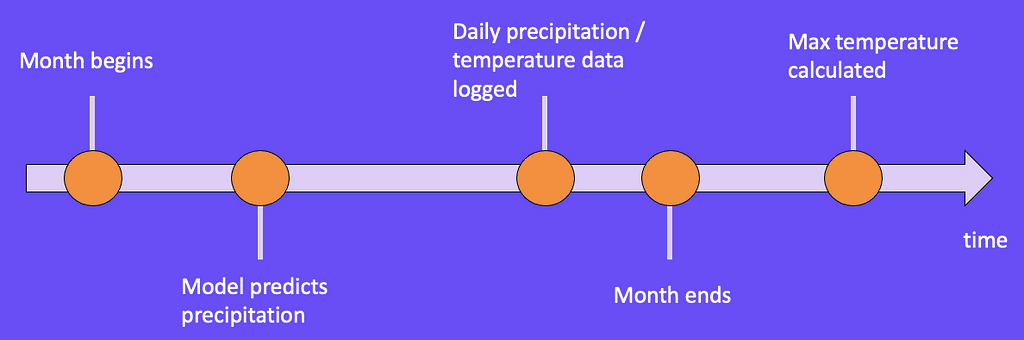
Figure 8 what a timeline might look like for our example. On January 1st, our model predicts how many inches of precipitation we will get for that month. Throughout the month, we collect daily precipitation and temperature data until January 31st when the month ends. It’s only when the month ends that we can calculate the maximum temperature for January.
When mapping related events onto a timeline, it’s important to note where the model makes its prediction. Once we find that point, we only want to include information that occurs before that point.
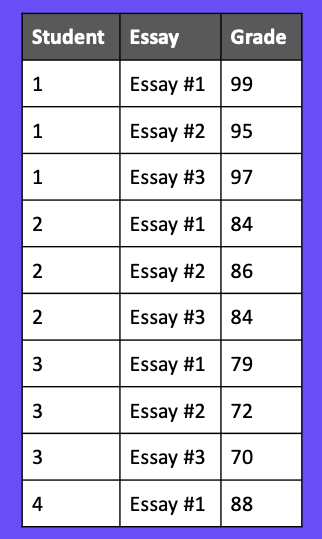
Example #3 — Don’t Randomly Split Groups
Now that we’ve seen a couple of examples with time series data, let’s take a look at a classification problem with data shown in Figure 9. For this example, we have students, essays, and their scores for each essay. Let’s say we want to make a model that will predict a student’s essay score based on the text of their essay.
Those unfamiliar with data leakage might start by creating a 60/40 train/test split as we’ve done in previous examples. You can see in Figure 10 that students one, two, and three are each in the training and test sets.
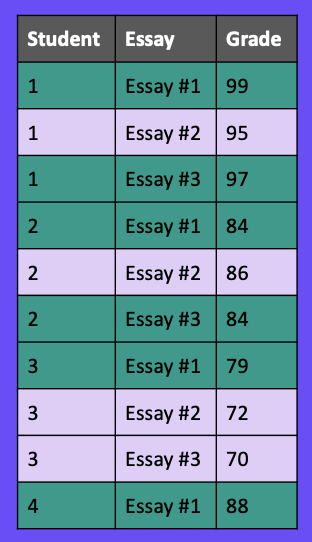
When we split our data this way, our model may unintentionally learn writing behaviors and patterns specific to a specific student. This can cause our model to perform very well on our test set since it has already seen writing from those students, but perform much worse when it sees a new student’s writing.
Instead of randomly splitting our data, we want each student to be only in the training set or only in the test set. In Figure 11, you can see students one and two are only in the training set, and students three and four are only in the test set.
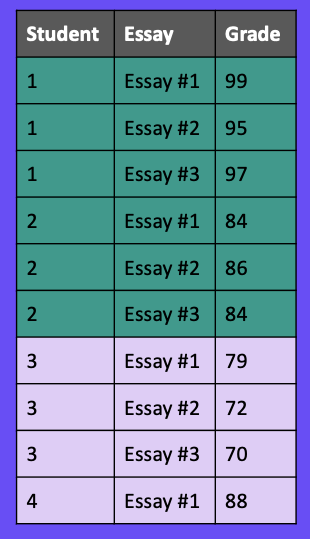
The Python library scikit-learn makes this simple to implement with a function called GroupShuffleSplit. In this function, you specify the column to use as your indicator for splitting your data (Student Number for us), and then it takes care of the rest. We highly recommend using this function if your data has some sort of natural grouping.
Example #4 — Don’t Forget Your Data is a Snapshot
Oftentimes in academia, you’re given a dataset that does not change; however, in industry, your dataset is constantly changing. For this next example, let’s say we have a website with a click prediction model that will predict whether or not a user will click on an ad. The output of this model might be used to predict which ads to show users.
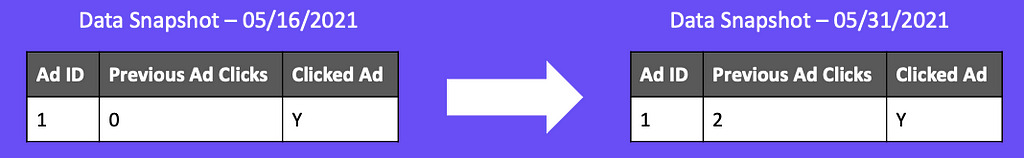
In Figure 12, we have user one who visits our site for the first time on 5/16/2021. Because this is their first time on our site, they haven’t clicked any ads previously. Let’s say we serve them an ad, and they click on it. A few weeks pass, and when we query our dataset, we notice that user one now has clicked on two ads previously as well as the current ad we’ve shown them.
If we include previous ad clicks as a feature in our model, we are leaking future actions for the user into our training set. When we train our model, we know that user one is going to click two ads. This may make more sense if we place our data on a timeline.
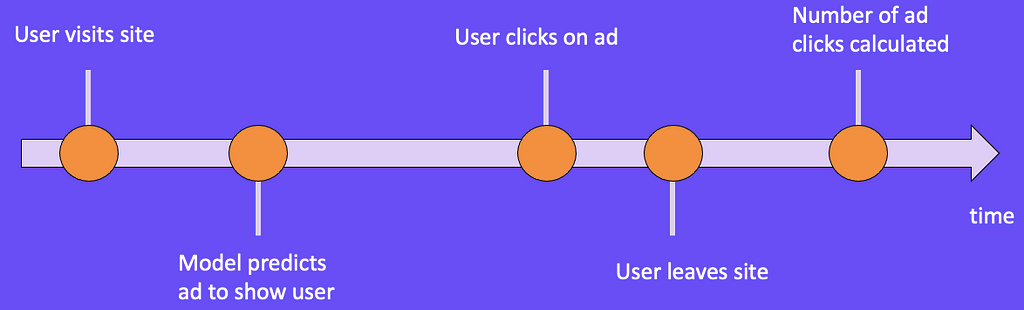
When a user visits our site, we show them an ad, and our model predicts whether or not the user will click the ad. The user might click on the ad and then leave the site. Then we can finally calculate the number of ads they clicked on the site. Similar to Example 2, we want to note where our model makes its prediction, and then only include information in the model that happens before that prediction.
Example 5 — Don’t Randomly Split Data While Retraining
Up until now, we’ve only discussed data leakage occurring when you train your model. If you come from academia, you may have only ever trained a model and not deployed it. In industry, once you’ve trained a model and deployed it to production, you will eventually need to retrain your model because your model sees data much different from what it was trained on. We’ll walk through an example of where data leakage can occur in the retraining process.
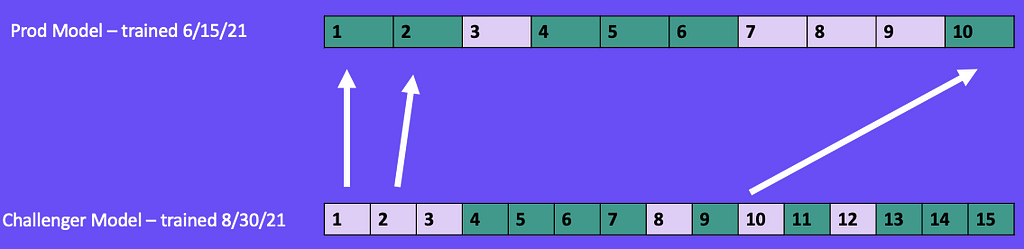
For this example shown in Figure 14, let's say we trained a model on 6/15/21 using a 60/40 random train/test split. Our model was trained on data points 1, 2, 4, 5, 6, and 10. It was tested on data points 3, 7, 8, and 9.

After deploying to production, several months pass, and our model performance gradually decreases, so it’s time to retrain. On 8/30/21, we train a new model (challenger) intending to replace the current production model. During the training of our challenger model, we used a 60/40 random train/test split. This included all of the 10 data points the production model was trained on as well as five new data points (11, 12, 13, 14, 15) we collected after the production model was deployed.
To compare these models, we want to have our production and challenger models both make predictions on the challenger model’s test set. However, when we go to make our predictions, we’ll find that the production model has been trained on data points that are in the challenger model’s test set (1, 2, and 10) which gives the production model an unfair advantage.
To further illustrate this, let’s look at the results of our production and challenger model predictions on the challenger model’s test set, shown in Figure 16. We know that the production model has already been trained on data points 1, 2, and 10, so you can see below it correctly predicts them. However, the challenger model hasn’t seen those data points before, so it incorrectly predicts them. Data points 3, 8, and 12 have not been seen by either model, so there is a mixture of correct and incorrect predictions.
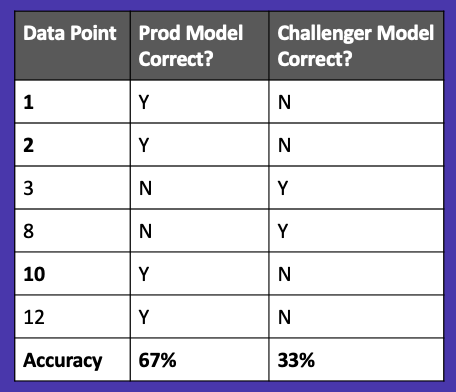
When we calculate our accuracy, the production model has a score of 67% while the challenger has a score of 33%. Looking at these results, we would likely keep the current production model and try out other challenger models. However, if we look closely, we will see that we’ve introduced data leakage into our production model, and it artificially looks better than the challenger model!
To prevent data leakage in this scenario, we must save all of our training and test sets. Let’s say we keep the same random train/test split for the production model. When we go to train our challenger model, we want to load in the training and test sets that we used for the production model and use those same sets for our challenger model. Then we’ll distribute our new data points (11, 12, 13, 14, 15) evenly between the training and test set. This will ensure the production model doesn’t accidentally know more than it should.
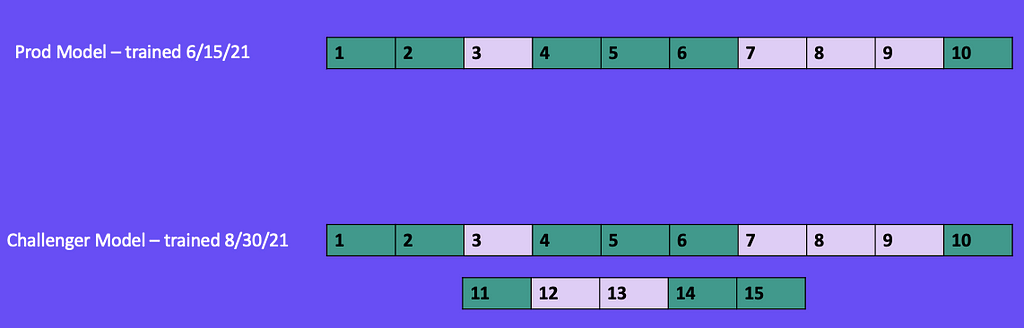
To further illustrate this, let’s compare our production and challenger model predictions on the challenger model’s test set. In Figure 128, we have an equal playing field because there are no data points that the production model has already seen.
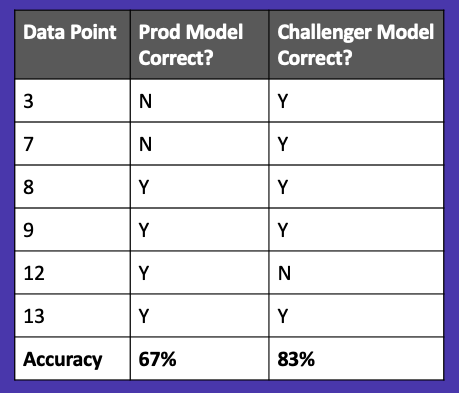
Now when we calculate the accuracy of each model, we find that the challenger model outperforms the production model.
Best Practice #1— Split Data Immediately
Now that you’ve seen a few examples of where data leakage might occur, let's walk through a few best practices that you should follow on every machine learning project to protect against data leakage.
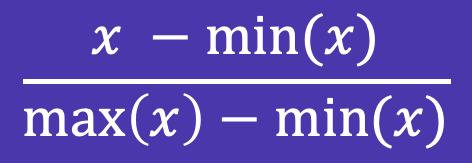
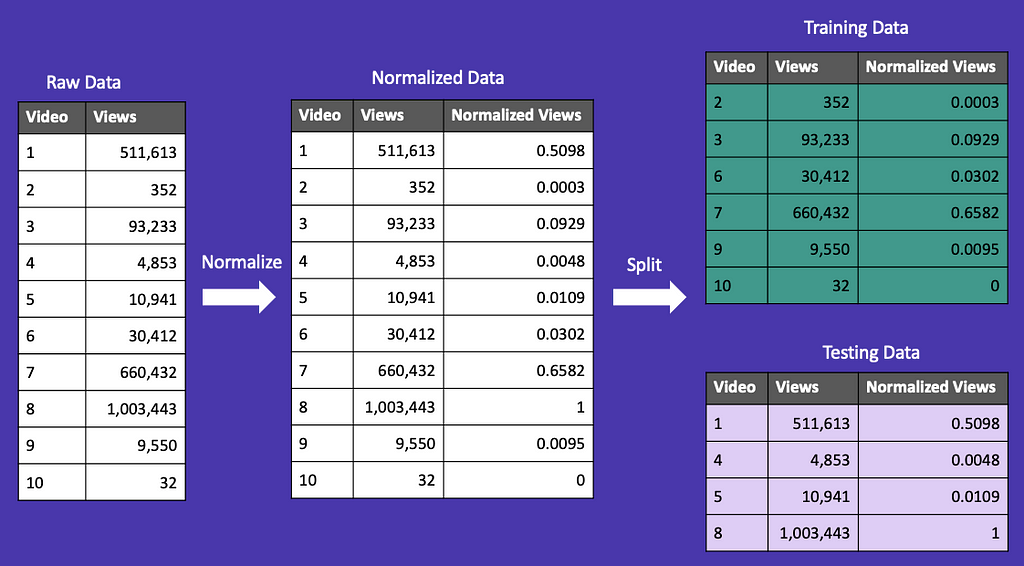
For this example, we have the number of views for several YouTube videos. To use the views as a feature in a machine learning model, we would need to normalize our data to adjust for outliers. One way we can do this is through min-max normalization. This takes the minimum and maximum of your dataset and uses them to transform your values between 0 and 1.
A simple mistake that’s easy to make is to split your data after normalization or other transformations. In Figure 20, we’ve done a 60/40 random train/test split after normalizing our data. You’ll notice that the normalized min and max (0 and 1) are split across the training and test sets. To prevent data leakage, both the training and test sets should have a min of 0 and a max of 1.
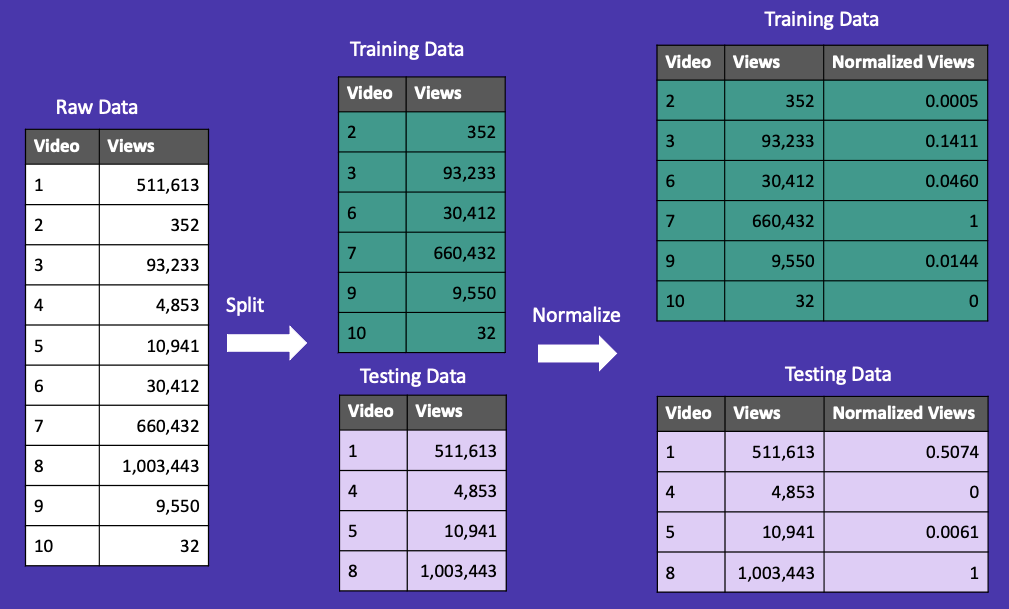
What we want to do is split our data first, and then normalize. You can see Figure 21 that the training and test sets each have a minimum of 0 and a maximum of 1.
Best Practice #2 — Use Cross-Validation
Throughout this article, we’ve split our data into two sets: train and test. Here we will introduce a third set called validation that helps prevent data leakage.
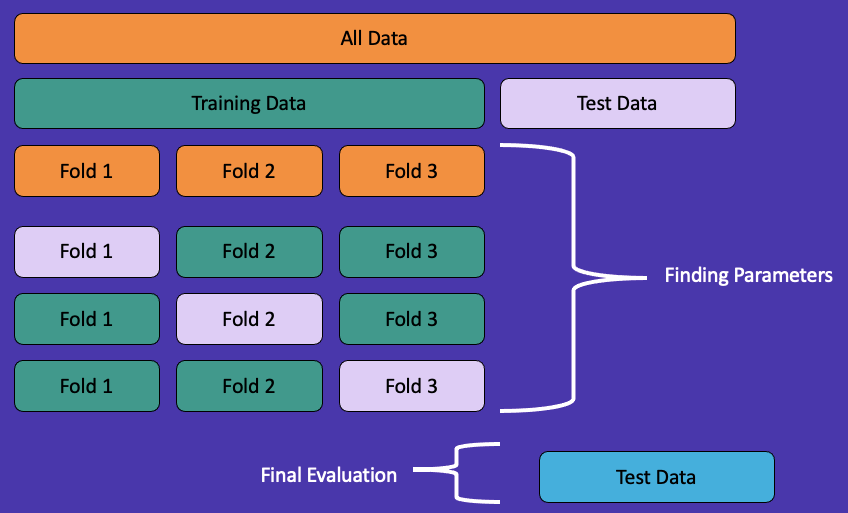
We begin by splitting our dataset into train and test sets. Next, we take our training set and split it into k-folds. For this example, let k=3. This will split our training set into three different parts (folds). Two of these parts will be used for training, and one part will be used for validation. We repeat this process by shuffling which parts are used for training and validation. Throughout this process, we find the best parameters for our model and then evaluate them on our original test set, which contains data the model hasn’t seen before.
While this process may seem complicated at first, scikit-learn has a simple implementation that you can call in one line of code. We highly recommend using cross-validation to prevent data leakage.
Best Practice #3 — Be Skeptical of High Performance
Nothing feels better than when your model reaches 99% precision, recall, or any other metric. Unfortunately, if it sounds too good to be true, it probably is. There’s a good chance your model might have data leakage and won’t be able to produce the same results on unseen data.
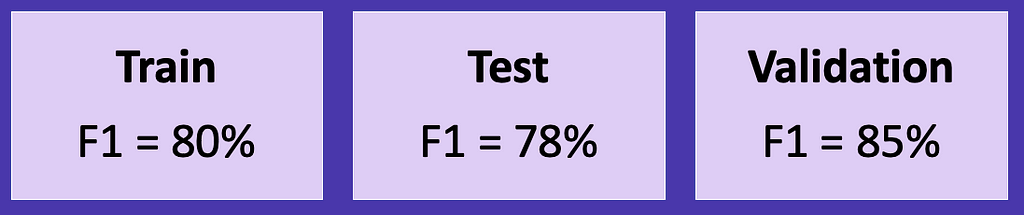
There are two different scenarios where high model performance might be a sign of data leakage. The first one is when your training and test sets perform well, but your validation set performs better than either set. If you see this in your results, you may want to think critically about your project setup and analyze it for data leakage.
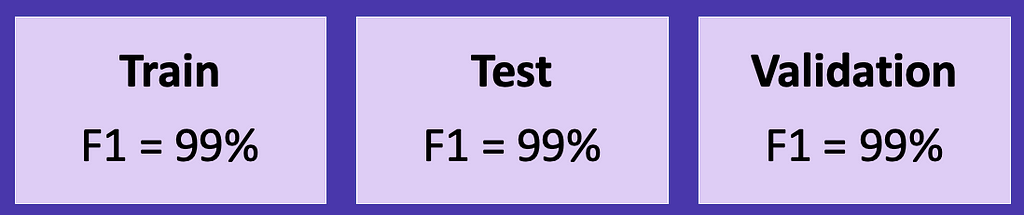
The second scenario that might be an indicator of data leakage is when your training, test, and validation sets all perform exceptionally well. In Figure 24, all three sets have scores of 99%. Your first instinct might be to celebrate, but you should probably review your project for data leakage before deploying to production.
Best Practice #4 — Use scikit-learn Pipelines
We’ve mentioned scikit-learn several times throughout this article for a reason — the library has a ton of great functionality for machine learning projects! One tool we recommend using from the library is called a pipeline. Pipelines are great at preventing data leakage because they apply a set of steps in a certain order and cross-validate them together.
The below example illustrating pipeline usage is from scikit-learn’s documentation. They first split their data into a train and test set and then create a pipeline that scales their data and applies a support vector classifier to make predictions.
from sklearn.svm import SVC
from sklearn.preprocessing import StandardScaler
from sklearn.datasets import make_classification
from sklearn.model_selection import train_test_split
from sklearn.pipeline import Pipeline
X, y = make_classification(random_state=0)
X_train, X_test, y_train, y_test = train_test_split(X, y,
                                                 random_state=0)
pipe = Pipeline([('scaler', StandardScaler()), ('svc', SVC())])
pipe.fit(X_train, y_train)
pipe.score(X_test, y_test)
Best Practice #5 — Check For Features Correlated with the Target
Our last best practice is to check if any of your features are correlated with the variables you are trying to predict (target). In Figure 25, we have some health care data, and we want to predict whether or not someone will get the flu. We might decide to include the “Took Antibiotics” column as an input into our model.
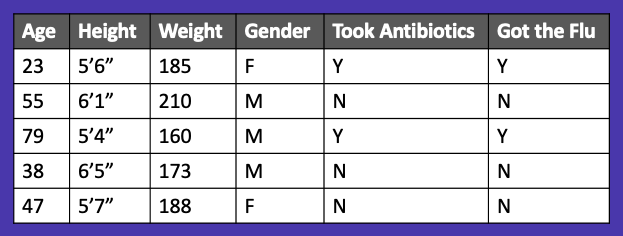
However, we should probably think twice when we see that that variable is highly correlated with the variable we’re trying to predict (“Got the Flu”). This may be a sign of data leakage.
Another way to think about this is by instead placing our data on a timeline as we learned earlier. You’ll notice that once we do this, we realize that you won’t take antibiotics until after you get the flu. If we included “Took Antibiotics” in our model, we would be leaking data from the future into our model.
Recap
In summary, data leakage occurs when your model knows too much information, and it can be extremely difficult to spot. We’ve covered a few different methods identifying and preventing data leakage, as well as some best practices for machine learning projects.
If you liked this article, we also teach data science courses on Skillshare. You can check out our course on data leakage and get a free trial of Skillshare using our referral link here.
References
- https://scikit-learn.org/stable/modules/generated/sklearn.pipeline.Pipeline.html
- E. Ameisen, Building Machine Learning Powered Applications (2020), https://www.oreilly.com/library/view/building-machine-learning/9781492045106/
- https://www.skillshare.com/classes/Data-Science-Mistakes-to-Avoid-Data-Leakage/1955732280
Data Science Mistakes to Avoid: Data Leakage was originally published in Towards Data Science on Medium, where people are continuing the conversation by highlighting and responding to this story.
from Towards Data Science - Medium https://ift.tt/7oFdiBnNO
via RiYo Analytics


No comments