https://ift.tt/31pakey How to easily check for associations between categoricals Image by Author Introduction During the course of a r...
How to easily check for associations between categoricals

Introduction
During the course of a recent project, I had to check a feature for associations (the lack of independence) with multiple other features. For convenience, I wrote a couple of functions to perform, and help interpret, tests for association between these categorical features. In this post, I will demonstrate this process and provide code examples that readers can use with their own data.
The Data
The dataset for this demonstration is the Open University Learning Analytics dataset¹. The dataset consists of 7 csv files of student demographic, assessment, and registration data; and course, course assessment, and learning environment data in tabular form. We will be looking at two of the categorical features, final_result and highest_education, from the studentInfo.csv file. This demo assumes that this data has already been loaded into a data frame df.
Features Tested
The final_result feature is the final grade awarded for the course (out of Fail, Withdraw, Pass, Distinction), and highest_education is the highest education level completed by the student. The ranking of these (UK) education qualification categories is as follows (from lowest to highest): No Formal Qualifications, Lower Than A Level, A Level, HE Qualification, Post Graduate Qualification.

From the graph it appears that lower education levels correspond positively with the Withdrawn and Fail outcomes, and higher education level correspond positively to Pass and Distinction. We want to test and quantify these notions, if possible, using statistical methods.
Contingency Tables
We will start our investigation by creating a contingency table for our data using pandas.crosstab, and instantiating a statsmodels.stats.Table object to provide us with convenient methods to find and display any associations. The Table class employs a Pearson’s chi-squared test to assess any associations.
# creating crosstab data frame
tabs = pd.crosstab(df.highest_education, df.final_result)
# creating a statsmodels table object
table = sm.stats.Table(tabs)
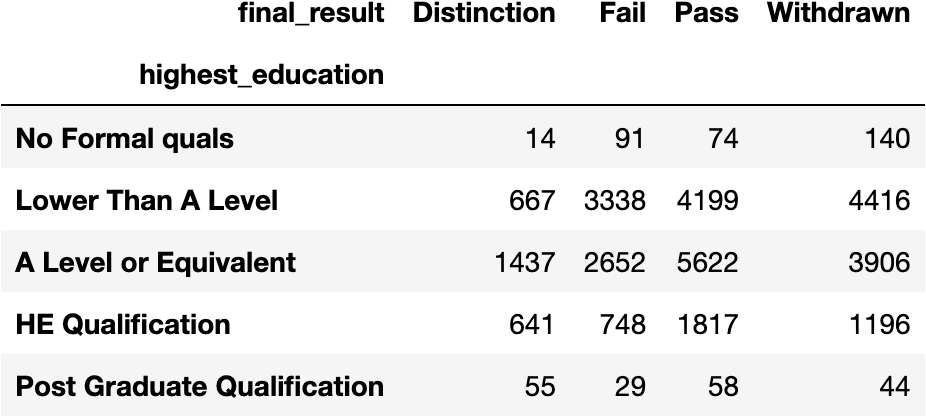
The table_orig method will return a contingency table of the origin data. Numeric cells in the contingency table represent the number of observations for the corresponding row and column pair.
table.table_orig
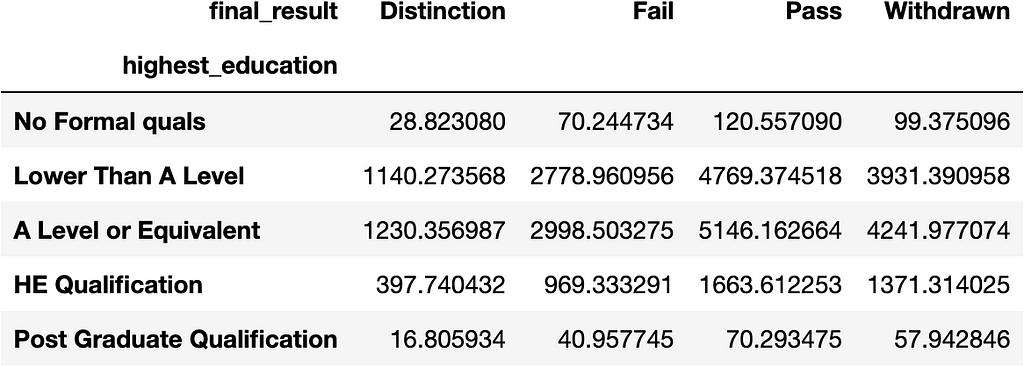
The fittedvalues method will return a contingency table of values from the best fitting independent distribution for the data.
table.fittedvalues
The resid_pearson method returns a table of residuals which will reveal any associations present in the data. Positive values indicate more observations than expected if the features were independent, and negative values indicate fewer.
table.resid_pearson
From the contingency tables it appears that, in general, Distinction and Pass vary directly with education level. The higher the student’s education level, the more likely the student is to pass or pass with distinction. Conversely, Withdrawn and Fail vary inversely with education level. In general, the lower the student’s education level the more likely the student is to fail or withdraw.
Next, we will perform a hypothesis test to verify our results.
Hypothesis Test
We will test for independence using scipy.stats.chi2_contingency. Similar to the Table class, chi2_contingency uses a Pearson’s chi-squared test to assess any associations in the data.
Let’s start by defining the null and alternative hypotheses for the test and specifying the significance level.
Ho = highest_education and final_result are independent.
Ha = highest_education and final_result are not independent.
The significance level alpha = .05.
Now that we have the preliminaries out of the way, we will run the test. I wrote a little function that will print the results in a nice format.
def chi_sq_test(cross_tabs):
    """
    Prints the Chi-Squared Statistic, p-value, and degress of freedom from a Chi-Squared test.

    Args:
        cross_tabs: A crosstab dataframe.
    """
    chi2, p, dof, con_table = stats.chi2_contingency(cross_tabs)
    print(f'chi-squared = {chi2}\np value= {p}\ndegrees of freedom = {dof}')
Applying the function to our crosstab data frame returns:
chi-squared = 962.2117100356752
p value= 2.4827414817328365e-198
degrees of freedom = 12
Since the p value returned is less than our alpha, we reject the null hypothesis and conclude that highest_education and final_result are not independent, confirming our findings above.
Lastly, we will check the effect sizes of our features.
Effect Size
Effect size is a measure of the power of the association between the two features. We will measure the effect sizes using a function I wrote to calculate and display the Cramer’s V value, Cramer’s V degrees of freedom, and the effect size thresholds for the data.
def cramers_v(cross_tabs):
    """
    Prints the degrees of freedom, effect size thresholds, and Cramer's V value.

    Args:
        cross_tabs: A crosstab dataframe.
    """

    # effect size data frame for cramer's v function
    data = np.array([[1, .1, .3, .5],
       [2, .07, .21, .35],
       [3, .06, .17, .29],
       [4, .05,.15,.25],
       [5, .04, .13, .22]])
    sizes = pd.DataFrame(data, columns=['Degrees of Freedom', 'Small Effect', 'Medium Effect', 'Large Effect'])

    # getting the chi sq. stat
    chi2 = stats.chi2_contingency(cross_tabs)[0]
    # calculating the total number of observations
    n = cross_tabs.sum().sum()
    # getting the degrees of freedom
    dof = min(cross_tabs.shape)-1
    # calculating cramer's v
    v = np.sqrt(chi2/(n*dof))
    # printing results
    print(f'V = {v}')
    print(f'Cramer\'s V Degrees of Freedom = {dof}')
    print(f'\nEffect Size Thresholds\n{sizes}\n')
Applying the function to our crosstab data returns:
V = 0.10148164448653103
Cramer's V Degrees of Freedom = 3

Effect Size Thresholds
   Degrees of Freedom  Small Effect  Medium Effect  Large Effect
0                 1.0          0.10           0.30          0.50
1                 2.0          0.07           0.21          0.35
2                 3.0          0.06           0.17          0.29
3                 4.0          0.05           0.15          0.25
4                 5.0          0.04           0.13          0.22
Adjusted for degrees of freedom, the Cramer’s V result indicates that highest_education has a small, statistically significant effect on final_result.
Conclusion
Hopefully, this demo has shed some light on a simple, yet powerful, routine to check categorical features for associations. Feel free to use and modify the functions above for your convenience. Special thanks to Sgr Folge for pointing out an omission in the Cramer’s V code block in my original post.
Source
¹Kuzilek, J., Hlosta, M. & Zdrahal, Z. Open University Learning Analytics dataset. Sci Data 4, 170171 (2017) https://doi.org/10.1038/sdata.2017.171.
The dataset is freely available at: https://analyse.kmi.open.ac.uk/open_dataset under a CC-BY 4.0 license.
Contingency Tables, Chi-Squared and Cramer’s V was originally published in Towards Data Science on Medium, where people are continuing the conversation by highlighting and responding to this story.
from Towards Data Science - Medium https://ift.tt/3xNepoB
via RiYo Analytics

ليست هناك تعليقات