https://ift.tt/3BAk2qw Photo by Luke Chesser on Unsplash The fundamental assumption in developing any machine learning model is that t...
The fundamental assumption in developing any machine learning model is that the data that is used to train the model mimics the real-world data. But how do you assert this assumption after the model is deployed to production? This article introduces this problem in detail and shows how to handle it using Azure ML.
When you train a model in case of supervised learning the training data is usually labeled, when you deploy the model in production there is no actual label, no matter how accurate your model is, the predictions are only right if the data submitted to the model in production mimics (or statistically equivalent?) the data used in training. What if it doesn’t? We call it a data drift.
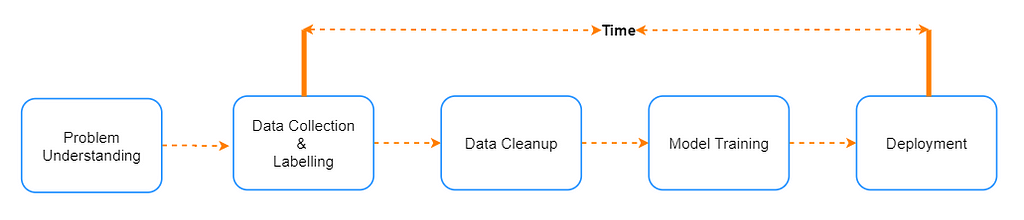
Data-drift is defined as a variation in the production data from the data that was used to test and validate the model before deploying it in production. There are many factors that can cause data to drift one key factor is the time dimension. If you observe the diagram below which shows high-level stages in the development of the machine learning model, it would be evident that there is a significant gap between the time data is gathered and the model is used to predict with real data. This gap can range from weeks to months to years, depending on the complexity of the problem. Several other factors can also cause drift like errors in data collection, seasonality, for example if the data is collected before covid and model is deployed post covid.
What if you do not identify drift?
When data drifts it is not identified on time, the predictions will go wrong, the business decisions taken based on the predictions may have a negative impact. Suggesting a wrong movie to a Netflix user is less harmful than suggesting a wrong stock, in some cases, the repercussions are delayed.
The effort it takes to handle the drift may vary depending on the nature, extent, and type of the drift, in few cases, data drift is manageable by retraining the model on the new data but sometimes we may have to go back to the drawing board and start from scratch.
It is not just data, even the model can drift, it is when the model’s predictions are no longer useful, for example predicting students who will opt. for online classes before covid and using it during covid times. One way to handle concept drift is online learning, where the model is re-trained on every observation.
It is important to build a repeatable process to identify data drift, define thresholds on drift percentage, configure pro-active alerting so that appropriate action is taken. There are various types of drifts like feature drift, concept drift, prediction drift, etc. but they all originate from the point the drift is detected either from the data or if the predictions are incorrect (incorrect predictions can be identified only if there is a manual way to find the right label, sometimes there is a delay in this too). Several great attempts are already made to define different types of drifts in the below blogs, so I’m not attempting to define them once again, please refer to the blogs below.
https://towardsdatascience.com/how-to-detect-model-drift-in-mlops-monitoring-7a039c22eaf9
How can we track data drifts?
Data drifts can be identified using sequential analysis methods, model-based methods, and time distribution-based methods. Sequential analysis methods like DDM (drift detection method)/EDDM (early DDM) rely on the error rate to identify the drift detection, a model-based method uses a custom model to identify the drift, and time distribution-based methods use statistical distance calculation methods to calculate drift between probability distributions. Some of the popular statistical methods to calculate the difference between any 2 populations are Population Stability Index, Kullback-Leiber or KL Divergence, Jenson-Shannon or JS Divergence, Kolmogorov-Smirnov Test or KS Test, Wasserstein Metric or Earth Mover Distance. A detailed explanation of each of these is beyond scope of this article, if interested in knowing you may start here.
How do you configure drift detection in Azure ML?
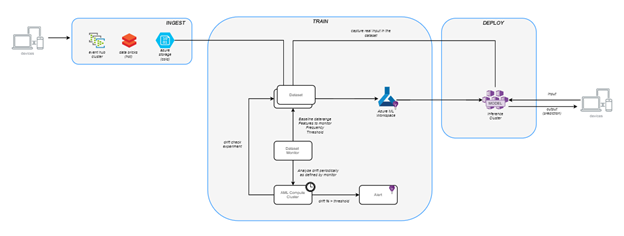
Microsoft provides an automated way to identify data drift which is integrated into Azure ML workspace, this feature is currently in public preview. Azure ML uses statistical methods to identify drift, different time windows are used to calculate the drift for selected features. A typical ML Ops workflow involving a data drift monitor would look like the one below. The next sections explains each step involved in this process.
Implementing data drift in Azure ML
The steps involved in identifying data drift are
- Register the baseline dataset: The baseline dataset is the dataset that was used for model training. A dataset in Azure ML language is a pointer to the data which can be in any of the supported storage services like Azure Storage, Data Lake, etc. At the moment we can only identify data drifts with time-series tabular datasets.

2. Create a data drift detector: A drift detector object can be created by passing baseline and target dataset along with computing target to use and frequency of checks. The time ranges you choose here depend on the time windows that you want to compare, it is important to find a correct range to identify gradual drifts.
3. Feature selection: Before running the drift detection on demand, we need to provide a list of key features to monitor, this could be all the attributes of the dataset or a subset. Secondly, we need to backfill the monitor for the days we want to monitor, this should be done in chunks of 30 days max.
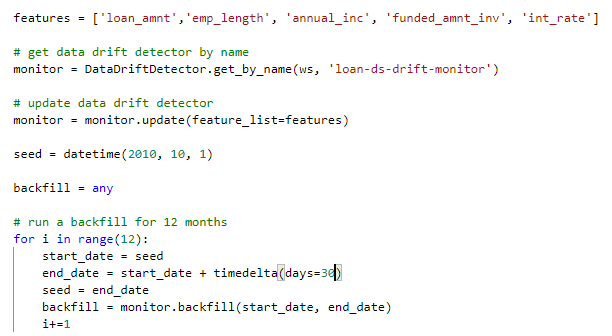
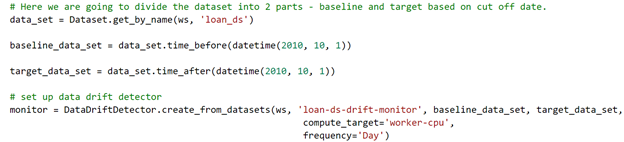
4. Run: You can then run the drift detection on schedule or on-demand. The below code shows the on-demand invocation of drift detection from 1st Oct 2010. Start the process and wait for completion.
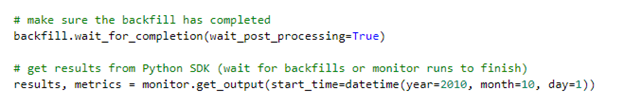
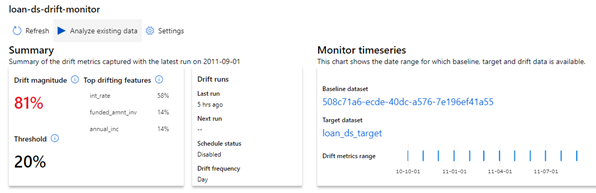
The output can be visualized from the notebook or from the Dataset->Dataset Monitors pane of Azure ML Studio, the below screenshots are taken from Azure ML Studio because I felt they are more intuitive. The statistical distance metrics that are available are Wasserstein distance (numerical features) and Euclidian distance (categorical features). As you may notice the drift is above the threshold and the percentage drift for each of the top features is shown at the top.
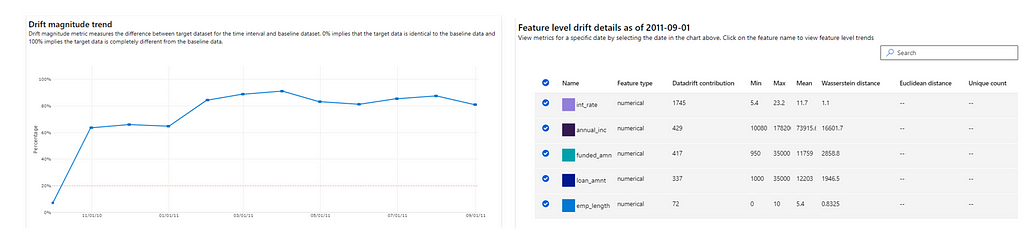
Apart from the reports above we can also get feature-wise drift magnitude and distribution. The complete source code can be downloaded from here if you want to try.
Explainable AI.
From this recent survey, it is evident that the enterprises prioritized the adoption of ML in the last 2 years, much of this can be attributed to rapid digitization and new ways of business caused by Covid. Along with the adaptation, it is equally important for these enterprises to understand the outcome of the ML model and not just look at it as a “black box”. Hence I expect to see more tools, frameworks, innovations in the future that are focused on “Explainable AI” a term used to make the predictions more explainable. In this context, I thought it would be wise to conclude this blog with other alternatives available, while there may be many I will particularly talk about 2 here.
- Evidently: EvidentlyAI is another open-source tool, which helps in evaluating and monitoring models in production. If you are not using Azure ML and looking for a non-commercial tool that is simple to use, evidentlyai is a good place to start.
- Fiddler AI Monitoring: fiddler.ai has a suite of tools that help in making the AI explainable, aid in operating ML models in production, monitor ML models and yes data & model drift detection is one of them.
- If you want to implement your custom methods you may use libraries like PageHinkley from river.drift and ADWIN from skmultiflow.drift_detection.
In summary, drift detection is a key step in the ML lifecycle and hence it should not be an afterthought it should be part of your plan to deploy the model in production, it should be automated, careful thought must be given to identify the drift methodology, thresholds to apply and actions to be taken when a drift is detected.
Why data drift detection is important and how do you automate it in 5 simple steps was originally published in Towards Data Science on Medium, where people are continuing the conversation by highlighting and responding to this story.
from Towards Data Science - Medium https://ift.tt/3bxz2uY
via RiYo Analytics


ليست هناك تعليقات