https://ift.tt/30sovyB Learn about the data mining technique used to optimize sales in retail and e-commerce industries Photo by Tamanna ...
Learn about the data mining technique used to optimize sales in retail and e-commerce industries

Anticipating customers’ interests is a strategy employed in many business models. Companies invest heavily in tactics ranging from taking customer surveys to building sophisticated machine learning models to better understand customer behavior.
One of the more prominent methods used is the market basket analysis, a data mining technique that identifies products that exhibit strong relationships.
This study can identify products with a high correlation that one would not detect at face value. It is a significant tool since knowing which products are conducive to the purchase of other products can enable businesses to promote and recommend items with a greater rate of success.
Here, we will cover the ins and outs of the market basket analysis.
Market Basket Analysis
The market basket analysis is a form of association rule mining that finds items with strong associations or correlations.
Before explaining the market basket analysis, it is important to cover some key terminologies.
A set of items purchased in a transaction is called an itemset.
An association rule is essentially an if-then statement, which aims to establish a relationship between the purchased items.
Suppose you are surfing the web looking for a new phone. After you place your phone in the cart, you decide that you want to buy a phone case as well. You add the phone case to the cart and make the purchase.
In this scenario, the itemset is {Phone, Phone Case}.
The association rule for this itemset is: if {Phone}, then {Phone Case}.
Products in itemsets can be broken down into two groups: the antecedent and the consequent.
The antecedent refers to products that are on the left side of an association rule.
The consequent refers to products that are on the right side of an association rule.
In the example, the antecedent is the phone, whereas the consequent is the phone case.
The market basket analysis entails finding the itemsets that exhibit the strongest associations.
That being said, finding the most notable itemsets by identifying and evaluating all combinations of items is difficult as it presents two problems.
Problem #1: We can not distinguish the most prominent itemsets at face value alone.
With the above example, it makes sense that the purchase of a phone has a strong correlation with that of a phone case. However, how do you evaluate items that are not so directly connected at face value?
Fortunately, there are a few evaluation metrics that help gauge the association between antecedents and consequents quantitatively.
The support metric measures the frequency of an itemset. In other words, it will tell you how often the purchase of the products in the itemset occurs.
The formula for the support metric is:

The confidence metric measures the likelihood of a consequent being purchased given the purchase of the antecedent.
The formula for the confidence metric is:

The lift metric measures the influence that the purchase of the antecedent has on the purchase of the consequent.
The formula for the lift metric is:

If the lift of an association is 1, then the purchases of the antecedent and consequent are independent.
If the lift of an association is greater than 1, the purchase of the antecedent increases the likelihood of the purchase of the consequent.
If the lift of an association is less than 1, the purchase of the antecedent decreases the likelihood of the purchase of the consequent.
With these evaluation metrics, we can filter out the combinations of products that do not meet the standards.
Problem #2: We can not process through all itemsets, given the sheer number of total combinations of itemsets.
Simply put, it is unreasonable to test and evaluate every possible unique itemset possible.
To put things in perspective, If you have 1000 unique products, there would be 499,500 unique combinations of 2 items that you would have to consider when finding the best association rules. The total number of combinations of any size exceeds the number of grains of sand on a beach.
Thankfully, there is a simple way to circumvent this issue.
The apriori algorithm is an efficient alternative that helps identify frequent itemsets while filtering out the infrequent ones. It can remove itemsets from consideration without having to evaluate them. This article won’t cover the inner workings of the apriori algorithm, but if you are interested, you can learn more about it here.
Shortcomings
Although the market basket analysis is a data mining technique with considerable usability, it is by no means an infallible study of consumer behavior.
Firstly, even if an association between products shows promising evaluation metrics, it can not directly prove the causality between the products. After all, correlation is not equal to causation.
Secondly, like any data mining technique, the market basket analysis is prone to errors. It can falsely omit significant associations or falsely include insignificant associations.
Keep these shortcomings in mind as you perform your analysis, lest you draw the wrong conclusions from your findings.
Case Study
We can demonstrate the market basket analysis by conducting a study with a dataset (copyright-free) storing e-commerce purchases that can be accessed here.
Here is a preview of the dataset.
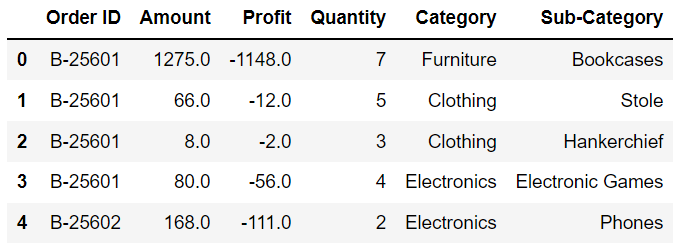
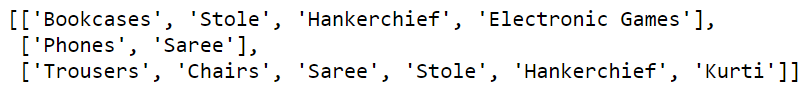
We are only interested in the items bought by each customer, which is mentioned in the ‘Sub-Category’ column. Let’s convert this column into a list of lists, with each list representing an itemset.
Carrying out a market basket analysis, which entails computing the support, confidence, and lift metrics for the associations in each itemset can be time-consuming if done manually. Thankfully, the mlxtend module in Python allows us to perform such operations with ease.
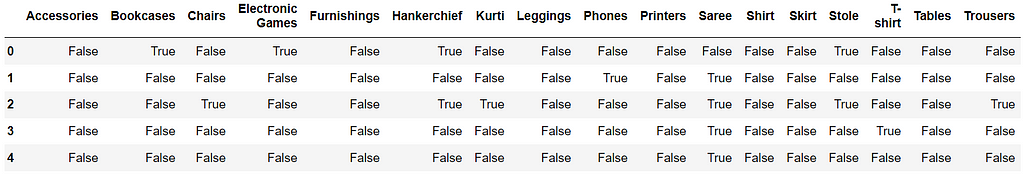
Now that we have our list of itemsets, we have to use the apriori algorithm to remove the infrequent itemsets from consideration. Doing so requires the data to be one-hot-encoded.
The mlxtend module has its own encoder that can one-hot-encode the itemsets.
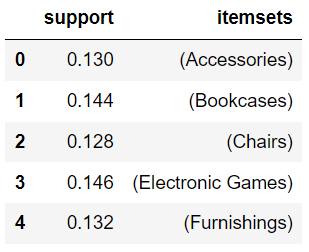
With the mlxtend module, we can use the apriori algorithm to identify itemsets that have a support value greater than or equal to 0.1.
Since the goal is to identify products with strong relationships, we will use the association_rules function to look for products with association types that meet the requirements.
In this case, we will deem the association in an itemset to be desirable if it has a lift value exceeding 1.
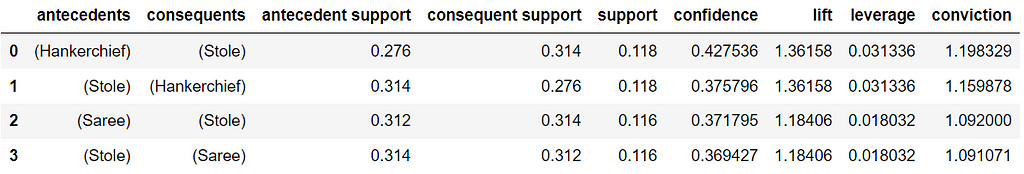
Based on the results, the itemsets with handkerchiefs and stoles have the highest lift values. It is worth looking into why the purchase of handkerchiefs increases the likelihood of the purchase of stoles and vice versa.
Remember that this study has only confirmed a strong correlation between the two items and not a cause-and-effect relationship.
A misleading takeaway from this analysis would be that it is ideal to aggressively market handkerchiefs to those who buy stoles. Such a conclusion can only be made after further exploring the underlying relationship between the two items.
Conclusion

Being able to understand consumer behavior is almost like a superpower.
That is why the market basket analysis stands out as a technique to rely on when finding patterns and trends in customers’ purchases.
The analysis itself may seem simple, but it serves as a part of a foundation for product recommendation and promotion systems that service industries will depend on for many years to come.
I wish you the best of luck in your data science endeavors!
References
- Roshan, B. (2019). E-Commerce Data, Version 2. Retrieved November 12, 2021 from https://ift.tt/3nj8JiB.
Understanding Consumer Behavior With The Market Basket Analysis was originally published in Towards Data Science on Medium, where people are continuing the conversation by highlighting and responding to this story.
from Towards Data Science - Medium https://ift.tt/3qExJmB
via RiYo Analytics


No comments