https://ift.tt/311yMmb Kurtosis — How to Explain to a 10-year-old Making less intuitive concepts, intuitive Photo by Алекс Арцибашев on...
Kurtosis — How to Explain to a 10-year-old
Making less intuitive concepts, intuitive

Kurtosis is one of the core concepts in descriptive statistics and is also part of standardized moments in mathematics. The concept itself though easy is often misinterpreted and misunderstood because of the vague definition associated with it. In this article, I’ll try to explain the intuition behind kurtosis and its characteristics in very simple terms as I’d convey it to a 10-year-old.
If you’re hearing the words kurtosis for the first time, the story will help to grasp the core concept behind it. If you know it well and perhaps want to explain this to your niece or nephew (or someone who is non-stats-savvy), this will help with that
The story goes like this:
Imagine you’re going grocery shopping with your parents. Since they have their hands full, they ask you to carry two, five kg bags on each arm. You grudgingly agree and carry each 5KG bag in each arm.
Now, you notice something. The closer the bags are to your body, the easier they are to carry. The farther outstretched your arms are from your body, the harder it gets to manage the weights.
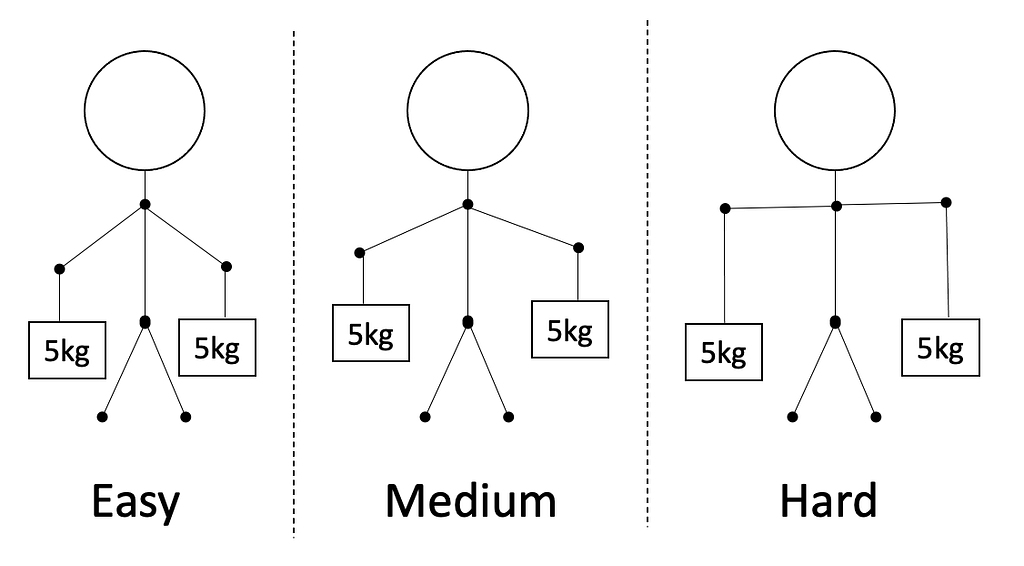
In this particular example, the farther you move away from your body, the harder it gets and higher the kurtosis. The distance from your center of gravity in the above example is proportional to the intuition of kurtosis (and the difficulty to manage the weights) or can be said as equal to kurtosis for the sake of simplicity.
Now if we increase the weight from 5kgs to 10kgs and then to 15kgs, the difficulty starting from easy to medium to hard also goes up rapidly and so does the kurtosis value.
Now replace yourself in the above example with a normal distribution probability density function. Since most of your weight is concentrated very close to your center of gravity, you are said to have a Pearson’s kurtosis of 3 or Fisher’s kurtosis of 0.
What we learned:
Kurtosis, in very simple terms, is the weight on the extremes ends of a distribution. In the above example, the weights, farther away from your center of gravity were harder to handle/manage
Fisher’s kurtosis compares how tail-heavy a distribution is with respect to a normal distribution (regardless of its mean and standard deviation). A positive Fisher’s kurtosis means the distribution has significant outliers while a negative Fisher’s kurtosis would mean that the distribution of probability density is much more uniform compared to a normal distribution
Distributions, which have 0 or very close to zero Fisher kurtosis are called Mesokurtic distributions. Normal distribution falls under this bucket.
Distributions, that are uniform or flat-topped, have negative Fisher’s kurtosis and are also called platykurtic distributions. Ex: uniform distribution
Distributions with high positive Fisher’s kurtosis are called leptokurtic distributions. Leptokurtic distributions are ‘tail-heavy distributions that suffer from outliers that may require handling or processing depending on the use case. Ex: Levy distrbution, laplace distribution etc.
The formula for computing kurtosis:
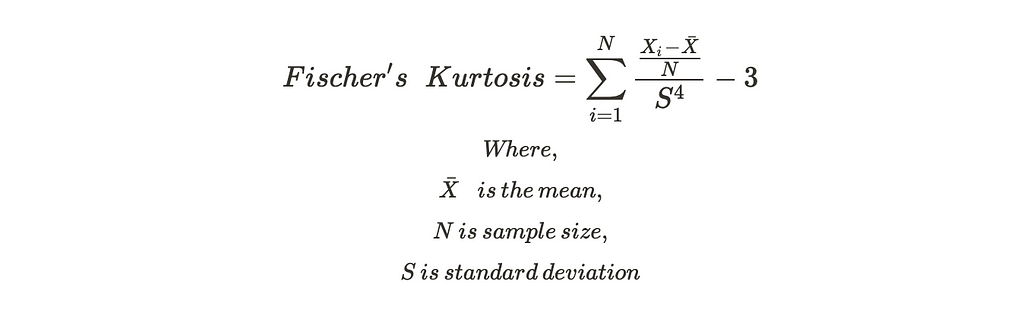
The -3 component is added to the Pearson’s kurtosis to make it centered around the normal distribution and hence is also referred to as the ‘excess kurtosis’
Python implementation
Kurtosis can be conveniently computed via scipy package. Below is a code for reference for computing kurtosis for various important distributions
import scipy.stats as stats
from scipy.stats import kurtosis
distribution_names = ['uniform', 'norm', 'laplace', 'levy']
for distribution_name in distribution_names:
    if distribution_name == 'uniform':
        distribution = getattr(stats, distribution_name)(loc=-2, scale=4)
    else:
        distribution = getattr(stats, distribution_name)
    sample_data = distribution.rvs(size=1000)
    kurtosis_value = kurtosis(sample_data, fisher=True) # notice the fisher param
    print(f"kurtosis value of the {distribution_name} distribution is {round(kurtosis_value, 2)}")
Output:
As expected, the kurtosis for levy distribution, a notoriously outlier heavy distribution has a very high kurtosis value compared to other distributions. The value of the normal distribution is not exactly zero, since it is not taken from a continuous distribution. If you play around with the sample size, the larger the sample_data size, the closer you get to zero. If we increase the dataset size to 10⁸, we get the below result
As you might’ve also noticed, the kurtosis for tail-heavy distribution explodes as the sample size increases.
Further reads:
- Python Scipy documentation: https://docs.scipy.org/doc/scipy/reference/generated/scipy.stats.kurtosis.html
- Moments in mathematics: https://en.wikipedia.org/wiki/Moment_(mathematics)
If you liked the intuitiveness and simplicity of the article, you might also like some of the other simplified versions of the statistics concept below:
- Eigenvectors & Eigenvalues — How to explain to a 10-year-old by Sundaresh Chandran in Towards Data Science
- Entropy, explained simply by Sundaresh Chandran in Towards Data Science
Please leave a clap/comment in case you found it useful.
Kurtosis — How to explain to a 10-year-old was originally published in Towards Data Science on Medium, where people are continuing the conversation by highlighting and responding to this story.
from Towards Data Science - Medium https://ift.tt/3HPzaF7
via RiYo Analytics


No comments