https://ift.tt/3k96Cfs How We Pinpointed the Generalized Impact of 73 Kinds of Severe Weather on Fast Food and Retail Demand And how to ar...
How We Pinpointed the Generalized Impact of 73 Kinds of Severe Weather on Fast Food and Retail Demand
And how to architect machine learning models with dynamic feature sets to overcome data sparsity
We all know severe weather impacts demand for quick service retail chains. Those working in the industry know it impacts for longer than simply the day or two of the event itself. But building a model to accurately identify these demand impact patterns was impossible for QSR chains given the limited frequency and distribution of severe weather event data. Here’s how my team tackled it and successfully pinpointed the multi-day impact of 73 different kinds of severe weather events.
You can’t power a forecasting model or a scalable demand planning organization on anecdotal knowledge. You need information — you need numbers. So my team needed to find a way to turn the costly chaos of severe weather impact into accurate impact figures as soon as a watch or warning was issued. This needed to include:
- How long a severe weather event impacted demand, covering the day(s) of event as well as leading and lagging day impact
- How much, on average, QSR demand was impacted for each of those days
Spoiler alert: it was very challenging. But we landed on 73 generalized Demand Impact Patterns for the QSR industry. Please note these can vary significantly by location (more information below.)
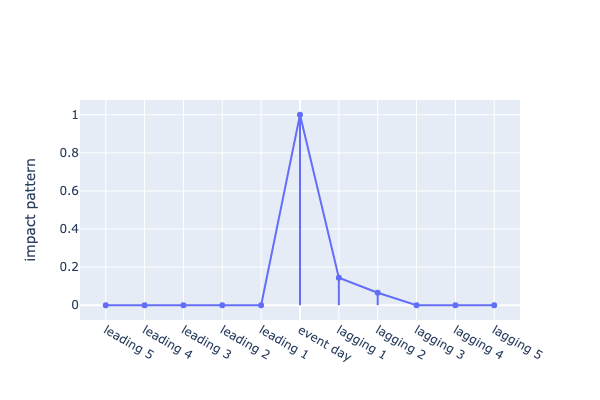
The generalized Demand Impact Pattern for a QSR for a mid-level Tropical Storm — note how the first day it has impact is the day of the storm itself, but its impact lingers slightly.

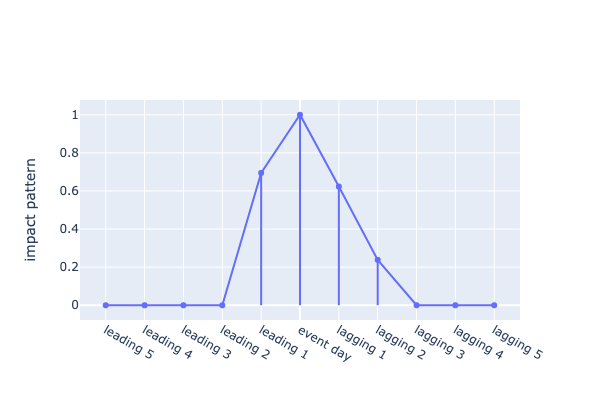
The generalized Demand Impact Pattern for a QSR for Air Quality Warnings is different. Impact begins before the day of the event itself, the warning, as the air quality worsens, and it takes longer to dissipate so has been found to have a longer impact on demand.

Please note the visualizations above assume the severe weather event is a one-day event, but many severe events last longer.
While 26,793 severe weather events occurred in the USA in 2019, there are many kinds of severe weather events and they occurred across a very wide distribution. This means data sparsity — relevantly similar events occurring in relevantly similar locations — was going to be a major challenge to overcome. I know many data scientists have brilliant plans for models but are thwarted by data sets that are too small and skewed to adequately train a model, so I want to share our learnings in this post to encourage my fellow data scientists to keep tackling what can feel like almost impossible problems.
Overcoming data sparsity — how to begin
Identifying an individual event’s impact on demand was not the issue. The challenge was finding a statistically accurate average impact for a kind of event across multiple locations and different kinds of QSR companies. This was challenging due to data sparsity and skewness.
My company PredictHQ was well placed to tackle this challenge as we work with many large QSR and retailers and have included verified severe weather watches, warnings and events in our data set for years. But even we didn’t have a surplus of demand data and weather data to draw on. During the pandemic, many of our large QSR and retail customers were coming to us asking for help in how to better manage severe weather events, which continued to wreak havoc on their plans even while the world was in lockdown. They knew this was important for three reasons:
- You can’t control the weather, but you can save millions by better aligning your staffing, inventory and supply chain strategies to the predicted impact.
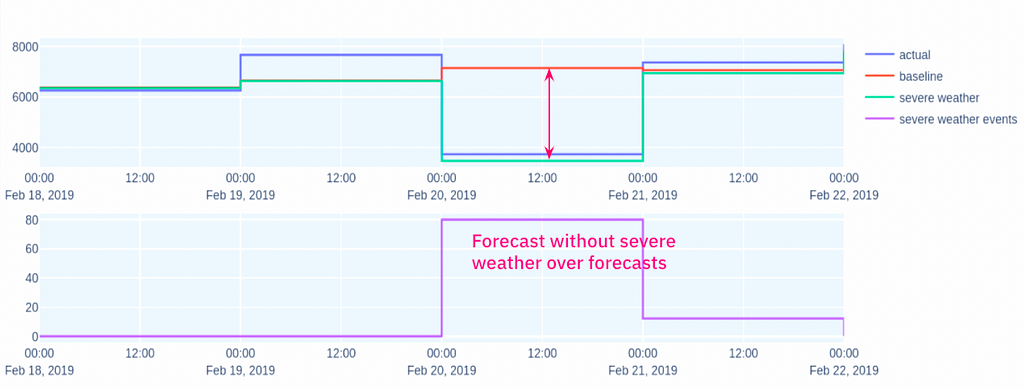
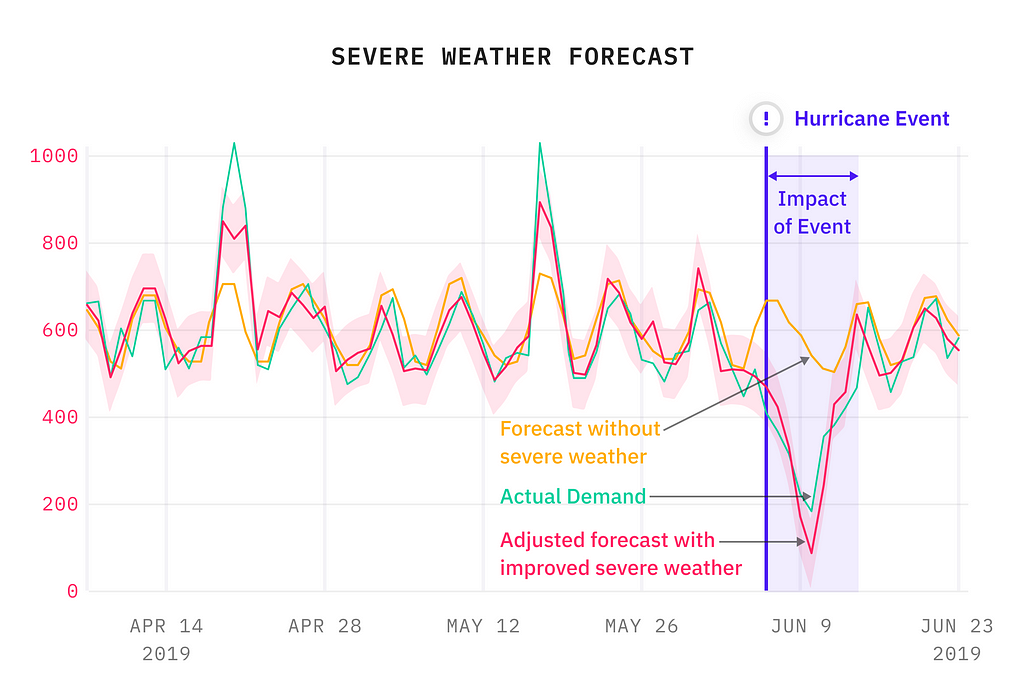
- You need to account for severe weather events in your historical forecasts, otherwise they distort your demand baseline leading to costly inaccuracies.
- As the world shifts to more dynamic and robust forecasting models, companies that forecast a week or two weeks ahead with a daily granularity are well placed to make rapid decisions to save money, if they have the right data.
If it was important for them, it was important for us. We had to overcome three elements of data sparsity:
- Enough similar events to identify their impact on demand for QSR companies as well as understand how the severity of an event impacted i.e. enough hurricanes across all categories of intensities, enough severe cold events, enough floods etc
- Enough similar enough events occurring at the same location
- Enough similar enough events occuring at the same location at the same time (and time is a really important factor here, there were multiple time periods we had to think about).

Assumptions are the enemy of good data science. We realized that rather than worrying about not having hundreds or thousands of near identical events in each location, we needed to identify which factors actually impacted demand in a statistically significant way first.
Step one: interspace and introspace testing to identify the necessary feature space
My team conducted interspace testing for all severe weather events in each season and each location with a range of granularity to identify what level of these factors was impactful. It meant we could rule out a number of features we had assumed were essential for many of our severe weather types. But the relevant features varied significantly depending on the event.
For example, winter storms and severe cold warnings only occur within winter, and so the seasonal feature was not important for these types. But we did learn that latitude mattered hugely for these severe weather types: the more northern they were, the more severe their severe cold warnings and events were, as well as their winter storms, so that did need to be factored in.
We found similar patterns with severe heat (more impactful in southern US states than the north), and different distinct patterns for each of our 73 severe weather types.
This testing enabled us to identify some of the most impactful features of severe weather events including:
- Location of event.
- Severity of event.
- Urgency of event.
- The probability of an event i.e. an out of season or far less frequent incident of an event in a location.
- The timing of an event: both the annual timing as mentioned above but also the weekly timing — a severe weather event on a weekend or other peak demand time for QSRs and retail had notably more impact.
- The certainty of an event: we track watches, warnings and events themselves so we needed our watches and warnings to reflect the evolving nature of the event.

Step 2: Dynamic feature set selection
As we researched, our models began to identify distinct patterns for each event type. We realized we had to build a model that would include dynamic feature set selection for each severe weather type. We also needed this feature set to keep evolving to ensure it stays accurate. In the era of climate change, severe weather events are increasing in severity and frequency, so our models need to be constantly updating for the situation right now, rather than relying on 20 year old data.
So far, we have identified 73 distinct severe weather demand impact patterns. This covers the intricacies of impact for the following severe weather types, but with distinct patterns for several based on severity:
- Floods
- Hurricanes
- Tornados
- Severe heat
- Severe cold
- Heat wave
- Hurricane
- Severe Rain
- Severe Sandstorm
- Severe Snow Storm
- Severe Storm
- Tornado
- Typhoon
- Severe winds
- Air quality
- Blizzard
- Cold wave
- Cyclone
- Dust
- Fog
We found different categories had different key impactful elements. For example, some severe weather types were more impactful when they occurred outside of their usual seasons such as severe rain, but some happened only within their seasons, such as winter storms and severe cold. This meant we didn’t need to incorporate this feature for those event’s models.
Another element that we discovered had a significant impact was latitude. Severe cold for example was far more impactful in the north of the USA, whereas hurricanes were much more severe in the south-east than the north-west of the US.
In the end, our beta includes 73 different demand impact patterns to capture these differences. These are added into every upcoming severe weather event in PredictHQ’s data.
Opting for an advanced machine learning model with a dynamic feature set over more simple models
Like many complex models, our prototype’s architecture was distinctly different to what we had imagined before we commenced our research. Once we were even a fraction of the way through our research, it was clear a rules-based model wouldn’t work.
Key to our advanced machine learning model was a constraint regularized regression model (CR2M). It has a regularizer so it would have a sensible shape that incorporated the preconceived knowledge about the kind of behaviors you expect to see. Then we trained it based on the pre-tested dynamic feature space so that it can learn the leading and lagging days plus the magnitude of the impact automatically.
Using this (aka several thousands of hours later), we began to arrive at exciting results such as:
- Out of the thousands of stores we tested, 58% of them could clearly benefit from severe weather event data when they had the Demand Impact Pattern to guide their models.
- For the 58% of stores impacted by severe weather, the mean relative WAPE (weighted average percentage error) improvement is 2.42%, and the maximum improvement was just over 14%
- Fundamental to this was our Demand Impact Pattern extended the forecasted days being impacted by unscheduled events from 46 days to 137 days, almost 2x more.
As even 1 percentage point of WAPE improvement translates to millions saved for the national QSR chains we were building this for, we were very excited about the results. I hope this account has been helpful for you, and that your data science team is also tackling and solving challenging problems.
For data scientists keen to explore severe weather data, we produced a Jupyter notebook for guidance.
How we pinpointed the generalized impact of 73 kinds of severe weather on fast food and retail… was originally published in Towards Data Science on Medium, where people are continuing the conversation by highlighting and responding to this story.
from Towards Data Science - Medium https://ift.tt/3k4CIbZ
via RiYo Analytics

No comments