https://ift.tt/3cvuNk9 Why it’s hard and what to do about it Co-authored by Shayak Sen Photos by Greg Boll , Michał Wichrzyński on Un...
Why it’s hard and what to do about it
Co-authored by Shayak Sen


The COVID-19 pandemic has sparked a lot of interest in data drift in machine learning. Drift is a key issue because machine learning often relies on a key assumption: the past == the future. In the real world this is very rarely the case. As a result, it’s critical to understand how changes in the data will affect the model’s behavior both before a model is deployed and on an ongoing basis during deployment. During the COVID-19 pandemic, for example, models across numerous industries were operating in uncharted territory due to the dramatic shift in the data and environment.
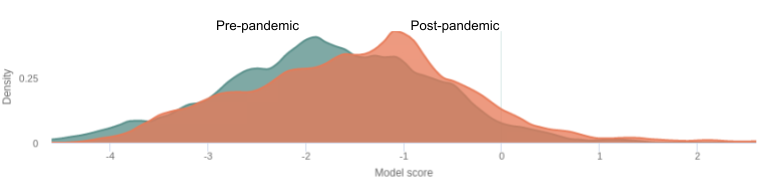
During the pandemic, data scientists were seeing patterns like the one in the figure above: model outputs had taken a significant turn in a particular direction. And trying to answer a number of questions:
- What is it in the data that is causing this shift?
- How does this affect the quality of my model?
- Do I need to change my model in any way?
This problem is aggravated in situations where ground truth data isn’t instantaneously available, making it hard to measure model accuracy before it’s too late. This is especially true in cases such as fraud, credit risk, marketing where the outcomes of the prediction can only be measured with a certain amount of lag.
While retraining is viewed as the silver bullet, in practice, retraining without sufficient understanding of underlying causes and consequences can lead to poor performance. In this article we will explore assessments of impact of drift and the nuances of retraining to prepare data scientists to address drift in challenging settings. We begin with an overview of standard drift terms and methods and difficulties in detecting drift and its consequences. We then discuss how understanding the nature and root causes of drift can lead to effective mitigation in practice.
An Overview of Drift

Why does drift happen?
The world and the context in which the model is applied potentially keeps changing. Some examples of the ways in which the data to which a model is applied to and was trained on can be significantly different are:
- The external world has changed: These can be external events such as the pandemic and interest rate shifts, or could be more internal events such as a breakdown in model pipelines leading to data quality issues
- The model is applied to a new context: For example, a language model trained on wikipedia data is then applied to news articles.
- The training data was drawn from a different set in the first place: This can be due to sample selection biases. Sometimes these biases are unavoidable. For example, for loan applications, ground truth is only available for individuals loans were given to.
What are the different kinds of drift?
When talking about drift, a number of different closely related terms may come up: covariate shift, concept drift, data drift, model drift, model decay, dataset shift, distribution shift. These terms refer to different assumptions about what’s changing.
- Covariate shift: distribution of input features changes.
- Concept drift: the relationship between the target variable and input features changes.
- Model decay: drop in model performance due to drift.
- Data drift: any distributional change. This is sometimes used instead to refer to covariate shift specifically.
- The other terms (distribution shift, dataset shift) can typically refer to any of the concepts above or a combination of them.
Identifying drift

The standard approach to identifying drift is to measure model performance (accuracy or otherwise) or to examine or measure differences in training and deployment distributions of:
- predicted outputs,
- ground truth,
- individual input features, or
- joint input features.
These approaches all provide worthwhile signals of drift, and should be used whenever possible. However, in practice they have serious challenges that make measuring drift a hard problem.
Curse of dimensionality — As the number of features of dimensions in data increases it becomes increasingly difficult to tell apart samples drawn from two distributions. This makes the measurement of joint drift between multiple features especially difficult and may impact measurement of drift in multi-class predictions or models with multiple outputs. The curse is also why a direct check for concept drift (a property of the joint distribution of all input and output features) may be impractical. This, however, may be moot due to the next challenge.
Lack of ground truth — A test of model performance in deployment may be sufficient to ascertain whether drift was significant enough to warrant intervention. Unfortunately the ground truth in deployment may not be immediately available. For example, in credit decisioning, whether a loan leads to a default may not be available until the loan period has passed several months or years later. In this setting, concept drift cannot be independently determined apart from other forms of data drift.
Inconsequential drift — It is often difficult to identify the impact of drift issues in the model. Often a large shift in a feature can be inconsequential because it changes in a way that doesn’t affect model behavior. Coupled with the fact that there is always expected to be some degree of drift, it can be really hard to triage whether a drift issue is worth addressing.
These challenges mean that whatever means of detecting drift employed in practice, it may be an imprecise indicator of actual drift and of actual consequences. It is important, then, to be mindful of the costs of the approaches to address drift.
What can we do about drift?

Having measured various forms of drift among the features, predictions, and/or ground truth, we can consider what to do about it. The first question one must ask is what consequences or the root causes of the drift are. That is, are the consequences of discovered drift damaging enough to warrant potentially costly actions? And if so, what are the key factors driving the drift. This is of course simpler when degradation can be measured directly but as we noted, in challenging cases, the impact of drift on performance cannot be determined or can only be estimated.
Prediction drift — Finding jointly important features is also a dimensionally cursed problem and so is the measurement of drift jointly among several important features. It is plausible, however, to focus on drift in the predicted output distribution assuming it is a significantly less dimensional concept. Drift among important inputs, whether jointly or independently should be reflected in drift in the output.
Root cause analysis — Once drift is detected, such model scores shifting, or accuracy dropping. It’s important to understand what the root causes are: which feature accounts for the drift. Techniques for measuring feature importance are invaluable in gauging root causes; drift in important features is more likely to cause degradation in performance than drift in less important features. However, standard feature importance metrics need to be adjusted for drifts and not just prediction importance. Features causing drift can be different from the most important model features.
Estimating accuracy — A holy grail capability for measuring drift is to be able to relate shifts in the data to model performance. This is a capability that the TruEra platform provides based on unique research from our ML team. The key idea is to aggregate shifts in consequential features to understand how it might affect model performance.
Mitigations

Retraining with additional label data is often touted as the canonical answer to data drift but depending on the costs or our certainty in the negative consequences of drift, may be not appropriate. A root cause driven approach to understanding drift can lead to significantly more precise mitigation strategies. Fix data quality issues
Very often the root cause of drift is part of the data pipeline being broken. The ability to do root cause analysis can quickly pinpoint features with issues. These can range from unexpected missing values to data type mismatches, which can be hard needles to find in large haystacks.
Remove feature(s), keep model — One option for dealing with features which are the root causes of drift is simply to remove them from consideration by a model, i.e. replace them with training mean or mode. This does not require gathering additional labeled data or retraining but might incur some loss in performance. If this loss, however, is lower than expected degradation due to drift, the removal may be the most cost effective option.
Remove feature(s), retrain — In some circumstances it may be possible to remove the drifting feature and hope that retraining uses alternate features to achieve similar predictive power. Note, however, that this will not help if the alternate features are causally related, the alternates will likely drift as well.
Add common feature(s) to new data, retrain —
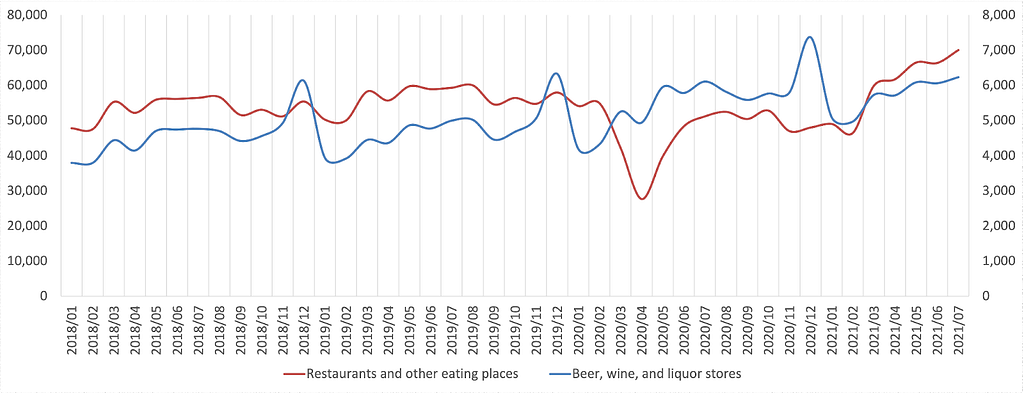
Drift may be predictable and may be periodic (e.g. retail spending like that for liquor in the figure above). Spanning your training data collection period over longer periods and periods in which periodic cycles occur, and including feature(s) indicating time or period (i.e. season, day of the week, etc) may result in a model that can respond to changes in time itself. This, however, has costs due to the over-reaching curse of dimensionality: assuming an additional period feature is consequential, the amount of data required for your model to learn its target concept’s relationship to the original features and now an additional period feature is increased. Additionally more care needs to be made to make sure data is representative of relevant time periods.
Add mitigators of rare events, retrain —
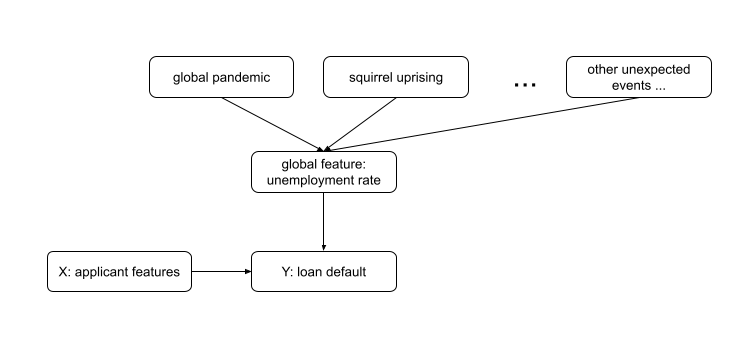
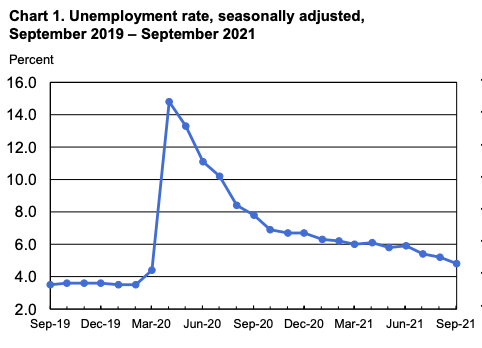
While some indicators of drift may be clear and not difficult to incorporate into a training pipeline, “unknown unknowns” are bound to creep in from time to time. An indicator of a global pandemic, for example, may seem like a pertinent feature for many modeling tasks, inclusion of such an indicator is likely a lost cause. Big impact events are unique and unpredictable. Here, feature engineering can benefit from causal analysis of the underlying task as more widely available indicators of drift may be available. For example, while presence of global pandemic may be an underlying cause of a reduction in certain types of loan repayments, an intermediate cause such as (un)employment rate may serve just as well and could cover, as an intermediary, other unexpected events difficult to plan for. Incorporating a local or global economic indicator at the time of a training sample could thus help a model for credit decisioning respond to drift in the concept it has acquired.
Add feature(s) to existing data, retrain — Another less costly option is to incorporate additional feature(s) into the training dataset. If this can be done for the existing training dataset, the label cost will not have to be paid. Adding features indicative of drift as outlined above would require that the existing data span sufficient time periods.
Regardless of whether new labeled data is required, the use of drift indicating features effectively converts a problem of concept drift to that of covariate shift.
Re-weight data, retrain — In theory a distribution between inputs and labels may represent a concept that does not vary from training time to deployment time. In practice, it does not mean that a particular training algorithm under a particular circumstance or phase of the moon will learn it from the sample of the data it has available. One reason for the disparity is that the training data is not sufficiently representative in certain regions for training to devote sufficient model capacity. If deployment data becomes dense in that region (i.e. drift), performance may suffer. Assuming there were at least some training samples in the region, up-weighing them can be used to help subsequent retraining devote more model capacity in the important regions.
Summing up

Drift is a challenging issue data scientists face while deploying models. In this blog we outlined the core reasons that make understanding and debugging drift challenging, and approaches to take a guided view to mitigating drift.
- Lack of ground truth complicates the problem of identifying impactful drift.
- Various methods for identifying drift are uncertain of drift and of its consequences on model performance to various degrees.
- Tools for root cause analysis of drift can guide data scientists towards the right solutions for addressing drift.Solutions may or may not involve labeling more data or retraining, and may involve fixing data pipelines or adjusting features used in the models.
Drift in Machine Learning was originally published in Towards Data Science on Medium, where people are continuing the conversation by highlighting and responding to this story.
from Towards Data Science - Medium https://ift.tt/3ng31hC
via RiYo Analytics


No comments