https://ift.tt/3HajpIn I analyzed 30k job descriptions to build a network chart of related IT-skills. Introduction IT job descriptions me...
I analyzed 30k job descriptions to build a network chart of related IT-skills.
Introduction
IT job descriptions mention tons of different frameworks, programming languages and other skills. Languages like HTML and CSS obviously go hand in hand, but what are the less obvious connections? In this analysis I parsed 30k job descriptions in order to map out how the different skills are related for professional positions.
I must admit I originally had another idea with the job description dataset, but along the way it seemed cool to make this network analysis. I will still finish the original project but in the meanwhile I would like to share the process of this “IT-skills analysis” with you.
Please bear in mind that this article merely describes the process of building the network. The actual result can be found here.
Getting The Data
From the start of this project I deemed finding data the hardest part. Basically I was in search for a dataset that met the following criteria:
- At least 10k records
- Contains the full text of a job description
- All job descriptions are for IT positions
- Preferably all in English
- Recent (less than 3 years old)
My initial idea was to scrape Indeed.com. I quickly built a simple scraper using BS4 but after about 1000 requests they blocked me. This gave me 3 options; improve the scraper to avoid getting blocked, scrape another source or look around for ready-to-use datasets. I opted for the latter and quickly found this dataset on Kaggle. Even though the dataset does not contain the full description, there is a column listing all the skills which was exactly what I needed.
I downloaded the dataset, spun up a Jupyter Notebook and called upon my loyal Pandas (Python library).
Entity Extraction
The Concept
Despite the fact the dataset contains a column with the skills listed, the data is still very crude. When analyzing this column we get the following metrics:
- Total skills: 366528
- Unique skills: 6783
- Shortest skill: almost any single character
- Longest skill: consultingcorrespondence
When looking at occurrences of each skill, the five most popular ones are; sales, management, development, executive and business. Taking all that information into consideration (total number of skills, misspellings and irrelevant or too generic skills) generating a limited set of relevant skills might be challenging. In network graphs we use the term entities, which in this case are the skills. Extracting the entities (or in this case getting a clean list of skills) is a key step of the process of generating network data.

The Approach
In our dataset, each record represents a different job description. The column “Key Skills” contains a list of the skills separated by a vertical bar ( | ), for example:
“Analytics| SQL| MS Office| Auditing| Financial services| Oracle| Data mining| Business operations| Asset management| Monitoring”.
After splitting the skills on the vertical bars, we have the long list as described above of 6783 unique skills. Now let’s try to bring this long list down to smaller, clean, usable and relevant skills.
First I tried to avoid as many obvious duplicates as possible by converting everything to lowercase and removing all leading and trailing spaces. This should make sure that for example “JavaScript” and “javascript” aren’t regarded as separate skills, merely cause of capitalization.
Once this is done, I filtered the skills down to only show those that appear at least 50 times. This brought the total count of unique skills down to 2079.
For further filtering, I used a Python library that indicates whether or not a word is in the English dictionary. Most technologies have names like “CSS” or “PHP” which hardly have any meaning in English. However some other languages and tools do have a place in the dictionary like “python” or “azure”, so for the remaining words some manual reviewing was required.
After completing this iterative process of human and computer reviewing and filtering I had a list of about 400 skills that are relevant for IT jobs to work with.
Connecting The Dots
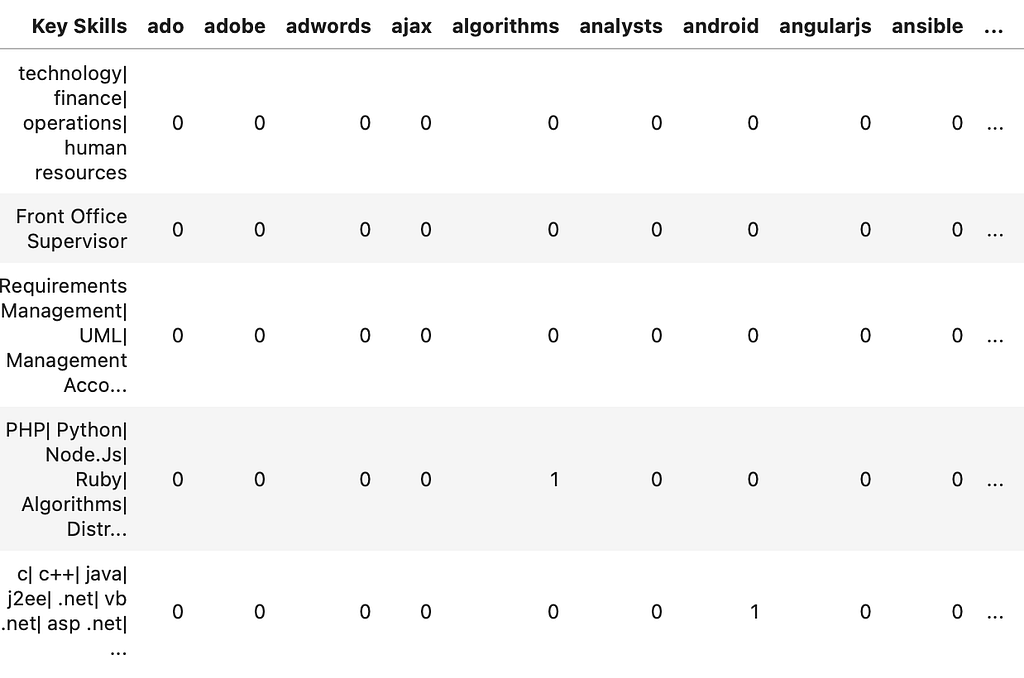
Ok so now I have the list of skills to work with and the full dataset, time to connect the dots. For counting the occurrence of each skill in the descriptions I used something called a dummy table. Basically it is a table where your columns only have 0/1 values that indicate a True or False position. The first column (or index) contains the job descriptions, while each column represents a skill. If the skill is present, the cell value (intersection between a job description and a skill) will be 1, otherwise it will be zero. The result looks something like this;

Using this dummy table, I created a correlation table. This table essentially indicates which columns (or skills) have similar patterns of zero and ones. In other words, it shows which skills often appear in the same job description. For example, if two skills always appear in the same description, they would always have “1 value” in the same records which would result in a perfect correlation: 1.
From the correlation table I could create a network chart table that has 3 columns; two for all the combinations of all skills (for example col A (source); ‘HTML’, col B (target) ‘CSS’ etc) and one with the correlation between both skills. I filtered this table to only show skill combinations that have a correlation of at least 0.15 (1 means perfect correlation). This is necessary to prevent what they call “a hairball”, a network chart with that many nodes and edges it becomes unreadable. Lastly, I added a column “Weight” which indicates how often the source skill appears in all descriptions. The weight will be used to determine the size (radius) of the nodes. Popular languages like JavaScript appear in many job descriptions and consequently will have a bigger weight.
This table contains all the information I need to visualize the result. However, even though the data is ready to be visualized we will come back to this step later. Network graph building is often an iterative process in which you use the final result (the visualization) to refine, filter and re-calibrate your graph model. This basically means you go back and forth between your data and chart in order to get the optimal result.

The Result
Visual Result
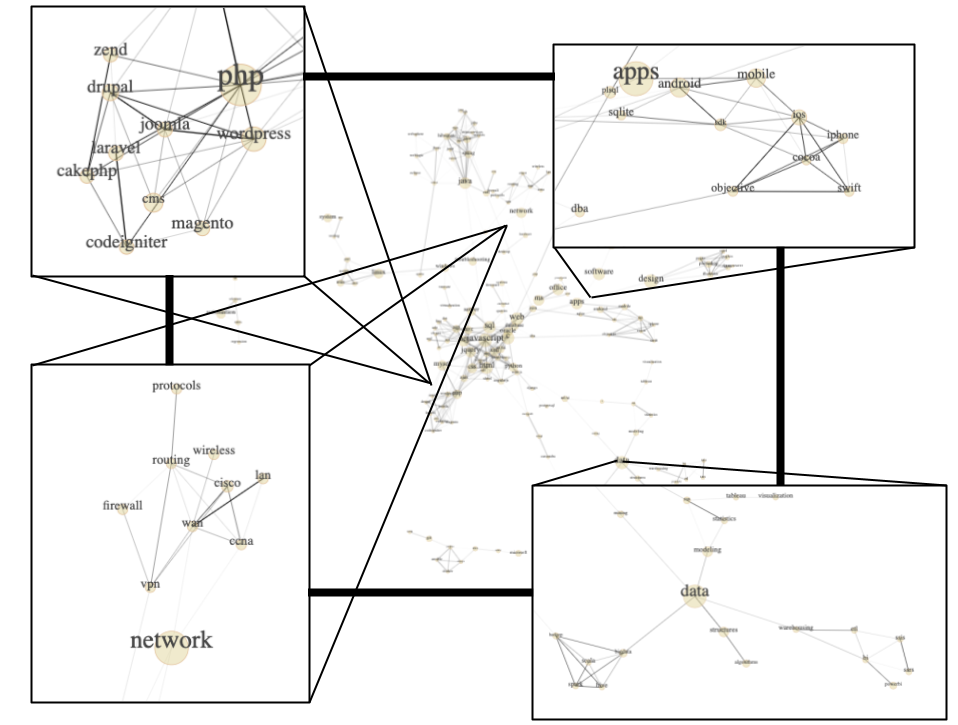
After converting the table from the previous steps to a JSON file, I built a D3.js force-directed graph. Which looks like this;

Of course this is merely a compilation of screenshots, the full interactive network chart can be found on my website where you can zoom and move the nodes by dragging.
The size of the nodes represent the total occurrence in the data while the thickness of the edges represents the strength of the correlation. In other words, two big nodes that are connected with a thick edge means both skills occur many times and are often found together.
Technical Details
For those more familiar with the development network graphs I listed some key metrics:
- Nodes: 177
- Edges: 415
- Average clustering coefficient: 0.48
- Transitivity: 0.48
- Number of cliques: 152

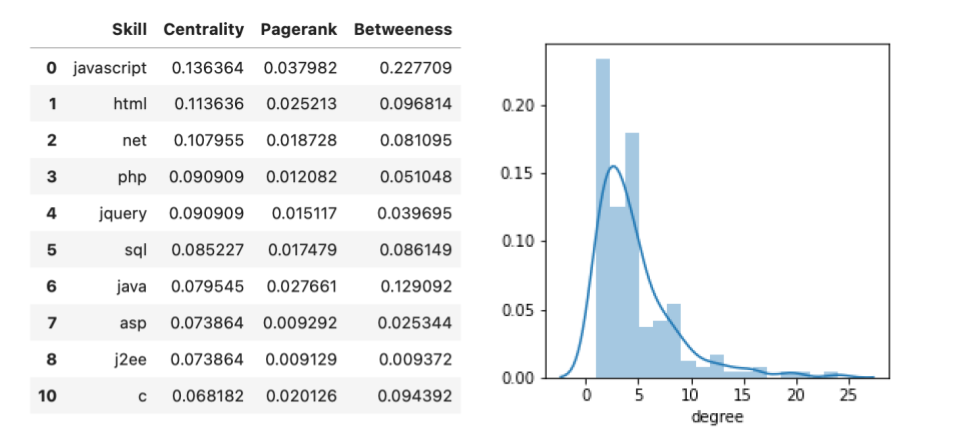
All the information shown in the table and the histogram are merely summarized versions of what is shown in the network graph. For example, centrality indicates for each node (or skill) how many edges (connections) it has relative to the total network.
Pagerank and betweenness are similar, yet more advanced metrics. If you want to read more about these (and other) network metrics, you can find it on Wikipedia or many other free online resources.
Insights
The network chart clearly shows different clusters defined by common roles in IT such as data, design, system, front-end and more. The chart also displays the key connectors in between clusters. This could be helpful in case you are looking to diverge into a new domain as the key connector skills offer a good place to start that are relevant for both domains.
People beginning their computer science or coding journey can also identify which skills could be a good start to gain personal growth in the cluster they are most interested in.
Although the chart does not offer any ground breaking insights that were yet to be discovered, it does seem to offer a very visual and accessible way to view the IT recruitment landscape.
Further Research and Improvements
More Data
This applies to almost all of my projects, both professional and personal. There are few cases where more data would not be beneficial to a model, metric, visualization or other data application. Although I was pretty happy finding this dataset with 30k well structured records, it would be nice to have more. Another possibility could also be to use the extracted entities and apply them to other datasets. This would be fairly straightforward, as clean data mostly needed for building the list of skills.
Time Series
Another insight I am often interested in are time series. For this project it would be particularly fascinating to see how the different IT-skills and their importance evolve. Over a multiyear period you would probably be able to see how certain new skills merge and expand while others will slowly shrink and die out like black dwarf in our galaxy.
Unsupervised Clustering
For most job descriptions, it is not hard to classify them in specific clusters of jobs. For example, most jobs requiring skills in machine learning are most likely labeled data science or maybe data engineering jobs. These clusters are often obvious and well known, but it would be interesting to find clusters in an unsupervised kind of way. This means we feed all the data to the machine and see if it can find specific (recurring) profiles for us.
Advanced Entity Pairing
Lastly, I feel a lot of improvements can be done on the entity pairing process. There is a limit to the time and effort I can invest in personal projects and I might have cut too many corners in this particular part of the development. Entity pairing is complicated and requires a decent amount of manual revision and domain specific knowledge. There are countless frameworks, languages and specialities of which many I am not familiar with. I might have removed relevant ones or maybe overlooked pairing them. Spending more time on the entity extraction and pairing will definitely improve this model.
Tech Stack
Python (Pandas, Numpy, NLTK and RegEx), JavaScript (D3.js), HTML and CSS.
About Me: My name is Bruno and I work as a data science consultant. If you want to see the other stuff I built, like a mumble rap detector, make sure to take a look at my profile. Or connect with me via my website: https://www.zhongtron.me
Building a Network of Related IT-Skills was originally published in Towards Data Science on Medium, where people are continuing the conversation by highlighting and responding to this story.
from Towards Data Science - Medium https://ift.tt/3n1JhOw
via RiYo Analytics

ليست هناك تعليقات