https://ift.tt/3D19u5j A-Z project to generate mood scores based on the songs I listen to everyday and color my online mood tracker accordi...
A-Z project to generate mood scores based on the songs I listen to everyday and color my online mood tracker accordingly

Here's a sneak peak of the final result!
Bullet journaling (or… bujo) is one of my main hobbies. Browsing through hundreds of Instagram bujo accounts, one thing that I most look forward to every month is the bujo artists' mood tracker template. These colorful collages of moods laid the foundation of this project of mine. As I was designing next month’s mood tracker, the idea crossed my mind that it would be great to have a system that automatically detects our mood and helps us fill in the cells everyday.

Ok, and… the data?
Music has always been an important component of my everyday life. My music’s relationship with my mood is generally linear: I listen to upbeat songs when I’m happy, to ballad songs when I’m sad, to healing rhythms when I’m stressed out. Thus, I decided to use songs I listened to on Spotify, especially their provided attributes through API such as acousticness, danceability, etc as indicators of a song’s happiness level, and subsequently, my overall mood.
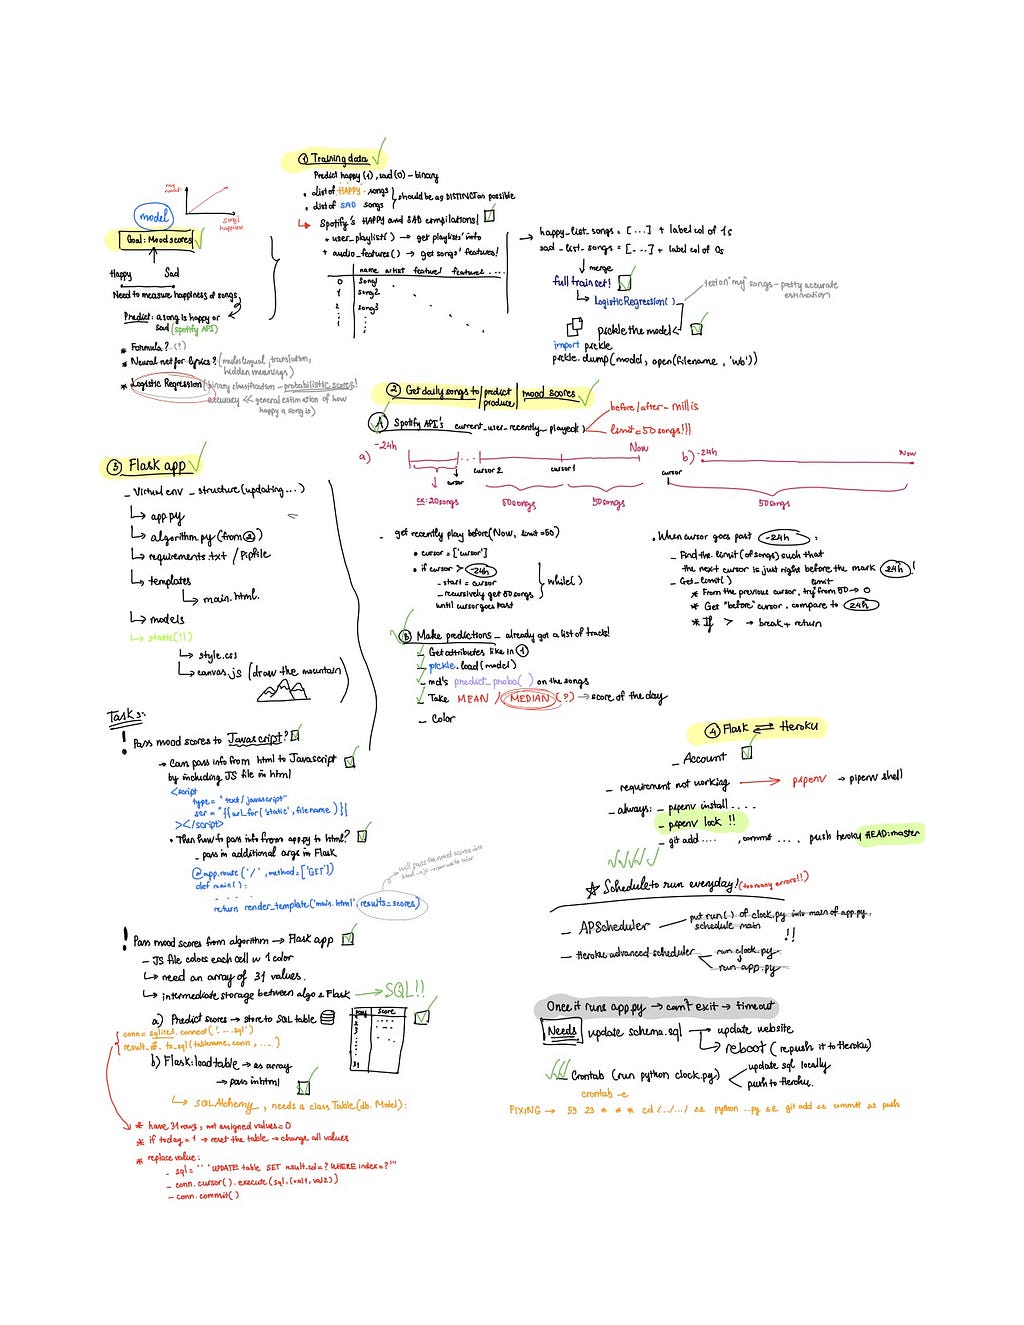
Having brainstormed a general project idea, I started to draft a checklist of the components of the pipelines, figuring out the order of which the tasks should be done and how I should tackle each of them. The below image is a documentation of my thought process and my development plan/progress for each stage:
Heroku
Heroku is a cloud platform that offers free option for basic hosting of Webapp, so it’s suitable for a small-scale personal project. All we need is an account!
After signing up, navigate to your personal dashboard and hit ‘New’ to create a new app (my app is called mood-journaling). Go to your app and under ‘Deploy’, choose Heroku Git as your ‘Deployment method’ and follow the steps listed out underneath to clone your project (currently empty) to your local work environment. We're going to add files into this folder and push the changes afterwards. With that, let's get started on the project!
Deciding on the model
First thing first, I need a model to produce the said mood score based on my music list. Determining the appropriate model requires taking a step back to focus on what the final outcomes look like. I believe that good models come from focusing on your end goal; a more complex model doesn’t necessarily make the best solution to one’s question.
As mentioned above, my happiness level is defined by how happy a song sounds. Thus, I need an algorithm that assigns a higher score to songs that has a happier vibe, and a lower score otherwise. K-Means, a unsupervised method often used for song analysis, groups songs by their similarities, but it's not helpful for my task since I already have two categories in mind. A deep learning model for lyrics analysis was an option too, but sentences in songs are generally short, repetitive and have hidden meanings. Plus, lyrics is not the main factor determining when I listen to a song, the rhythm is.
Cycling through different options, I concluded that I could obtain the desired outcomes with a binary Logistic Regression model. If I fitted the model using two very distinctive lists, one with upbeat, happy songs, and one with ballad-y, melancholy melodies, then I could produce a probabilistic prediction of how close any given song was to being a happy song. This probability could be used as my mood score. Taking the median of all the mood scores for all the songs in a day, I would have the final score ready!
Train the Logistic Regression model
From the training data…
Special thanks to Sejal Dua’s detailed guide to scrape songs with Spotify API for making this task easier than ever! Sejal's program takes in a list of Spotify’s playlist IDs and return a dataframe of all the songs' attributes, ready to be used to train the model. I fed into this function Spotify-made happy compilations (Mood Booster, Happy Beats, etc) and sad compilations (sad hour, Life sucks, etc)—those that contained very representative songs of the class. The full set amounted to around 1000 songs.
I trained the model with cross validation, with which it achieved an accuracy score of 0.89! I also used predict_proba on a personal playlist containing both sad and happy songs, and the probabilistic estimations the model assigned to the songs reflected the happiness level of each of them pretty well. The model was then pickled for use in our application.
import pickle
pickle.dump(lr, open("deploy_model.sav", 'wb'))
…to the prediction
In order to make predictions, I needed to get all the songs I listen to in a day. Out of all the functionalities offered with the Spotify API, current_user_recently_played is the closest function to producing the our target outcomes. However, it's limited to returning most recent 50 songs in one call. So I had to write a small program to scrape all the songs within the past 24 hours (illustration of how this works can also be found on my handwritten note).
Whenever I called this function, beside all the tracks, it also returned a cursor, which told me the timestamp of the 50th song I listened to (in milliseconds). For example, if I listened to 120 songs in the past 24 hours, then the 50th most recent song was, say, 5 hours ago. The idea was to get a batch of 50 songs at a time, extract this cursor, set the starting point to this cursor and start over to get the next 50 songs. The process stopped once the cursor of the batch I got exceeded the 24 hour mark. At that point, I would have to call a get_right_limit() function, which determined the number of songs I listened to since the last cursor that didn't go over the 24-hour mark. The code snippet is below:
The get limit function is as followed:
Once I got all the songs, the rest was to extract the features of these songs, just like how I did it in the previous section. After that, I loaded the pickled model with pickle.load(), and used predict_proba to produce the scores, which I would append to our dataframe as a column called “prediction”:
mixed = get_features_for_playlist2(mixed, curr_time, curr_time - 86400000) # 86400000 is 1 day in millis
lr = pickle.load(open('models/deploy_model.sav', 'rb'))
vnpred = lr.predict_proba(mixed.drop(['name', 'artist','track_URI'], axis=1))[:,1]
mixed.insert(3, 'prediction', vnpred)
# take the median score
day_median = float(median(mixed['prediction']))
Storing the results
I also needed a means of storage that would get updated when the above program was run, and from which the Flask app could easily retrieve and use the results. Here I used a SQL table. The code for storing and updating the results everyday is:
Worth noting that I had to create a table with 31 rows since the Flask app would retrieve all 31 values to look up the colors for the graph. All values in the table were initialized to 0. Whenever we turned to a new month, the table would be reset: all the old values would be clear and replaced with 0.
On to Flask and Heroku!

Flask environment
If you haven’t used Flask before, here’s a quick and helpful guide to install and get started! The list of all necessary files for our flask app can be found in my planner above.
Also in order to push your app to Heroku, I suggest using pipenv—a tool to create a virtual environment—since it does a good job locking all the necessary dependent libraries for your app (and cause me less trouble than using requirements.txt file!). In order to use it, use pip install pipenv, then type pipenv shell to activate the environment. In this environment, do pipenv install [list of package_name] to install the packages you need for your program. Finally, pipenv lock after you’ve done installations to lock all these requirements to your app. You’ll need to type this command again if you install any additional packages, before pushing the app to Heroku, otherwise the deployment will give you errors saying that there's no such modules.
SQL <-> Flask (app.py)
Now that I had the ready-made results stored in schema.sql, I went ahead to load it into my Flask app. In app.py, to easily extract the information from the table, I used a package called Flask-SQLAlchemy. First of all, I had to create the engine and declare the model with the following syntax:
app.py <-> main.html <-> javascript
The main.html file in “templates” folder is used by our Flask app to create the interface for the website. But in order to draw the figures and customize the colors, we need Javascript and CSS. Flask requires that we put .js and .css files in a different folder called static. I used Javascript's Canvas API and the RainbowVis package to produce the drawings. This stage required a lot of trials and errors before arriving at the final products, but it was also the most interesting part. The RainbowVis package provides a tool to generate an array of HEX numbers representing a gradient of 1000 colors from Blue (=Sad) to Green (=Neutral) to Yellow (= Happy). The idea is to round the mood scores to 3 decimal places, multiply them by 1000, and get the HEX color at that index.
Therefore, I had to pass the scores from app.py to the html file to the javascript file. After a round of Googling, I came up with the solution:
- To pass the scores from app.py to main.html, I used Flask-SQLAlchemy functions to query the score, or the “results" column, and passed it into html as an array through render_template(). I put this function under the default route since I wanted the drawings to be rendered right when we visit the front page.
@app.route('/', methods=['GET'])
def main():
    table = Mood.query.with_entities(Mood.results).all()
    table = [r for r, in table]
    # table is currently storing the mood scores
    return render_template('main.html', results = table)
- The scores are now stored in html in an array called results. To get the information in the array, we have to use the double curly braces. We can use console.log() to confirm that the array is successfully passed in.
- To pass the scores from main.html to canvas.js, I wrapped the codes in canvas.js in a function called draw(), which took in one argument: the array of values. Inside HTML, I called draw() and passed the table of mood scores in. The code is as followed. Note that the HTML file for Flask has slightly different syntaxes from a normal HTML file for including src and href.
- Now inside canvas.js, you can access the values in results with normal array indexing!
At this point, we've done setting up the links between different components in our app! If you type flask run we can see our application running on our localhost. What's left now, is to push it on Heroku, so that other people can see it!
Flask <-> Heroku
Following the next steps under Deploy, add, commit and push our files to Heroku (remember to pipenv lock before carrying out this step). Your terminal should show something like this:
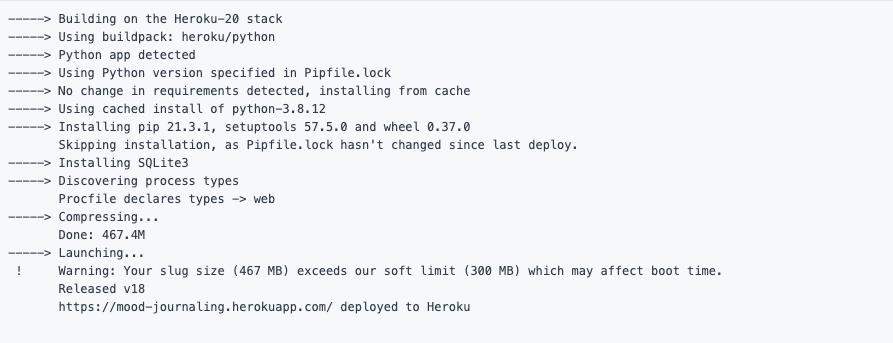
And if you go to the URL, it should show the exact state as was seen on the Flask app hosted locally on your computer when you do flask run. Voila!
Schedule to run everyday:
The very final step is to automate the program so that it runs at the end of each day and update the graph accordingly. To do this, I wrote a crontab script which ran clock.py every night at 11:59pm to update the SQL table with a new score for that day, then re-pushed the whole project to Heroku.
Note that for crontab to work properly on macOS, you'll have to authorize its use of your local folders. Go to System Preferences -> Security and Privacy -> Full Disk Access. Click on the lock below to enable making changes. Click on the ‘+’ sign, then go to the path ‘/usr/sbin/cron’. Check the box for cron, hit the lock again to lock the changes. And we're all set.
Type crontab -e to start writing the crontab script:
59 23 * * * cd /Users/irenechang/Desktop/PORTFOLIO/Fall2021/mood-journaling && /opt/anaconda3/bin/python /Users/irenechang/Desktop/PORTFOLIO/Fall2021/mood-journaling/clock.py && /usr/local/bin/git add /Users/irenechang/Desktop/PORTFOLIO/Fall2021/mood-journaling/. && /usr/local/bin/git commit -m "commits" && /usr/local/bin/git push heroku HEAD:master
And Done! Our program is set off to update on a daily basis!

Conclusions:
This was a fun and interesting idea-to-deployment ML project that I started out for the purpose of getting hands-on experience with Heroku and Flask, as well as familiarizing myself with working on an A-Z pipeline of a data science model. Hopefully you will enjoy the insights into your daily mood that this online bullet journal reveals as much as I do. Additionally, I hope this gives you a helpful guide for your own personal project, especially when it comes to deploying the model and figuring out the connections between multiple different elements.
Thank you very much for reading! My codes can be found in this repo! Feel free to reach out to me for any further idea or feedback through my LinkedIn, I would love to connect!
References:
- K-Means Clustering and PCA to categorize music by similar audio features
- End to End Deployment of A Machine Learning Model using Flask
- Pipenv to Heroku: Easy App Deployment
Build a Flask-Heroku Mood Tracker Web App Using the Spotify API was originally published in Towards Data Science on Medium, where people are continuing the conversation by highlighting and responding to this story.
from Towards Data Science - Medium https://ift.tt/3BYZmsI
via RiYo Analytics

ليست هناك تعليقات