https://ift.tt/3mHvQDv Let’s find out by using Spotify’s public API along with Julia Photo by Blaz Photo on Unsplash Recently, I came...
Let’s find out by using Spotify’s public API along with Julia

Recently, I came across some excellent articles where the authors had made use of Spotify’s API to analyze their music data. This made me very curious, and I decided to try doing something similar using Julia. Thankfully, the wrapper for the API has already been implemented in Spotify.jl, but the package isn’t registered yet. That’s of course not an issue, we can always install it directly from its GitHub repository.
In this article, I will demonstrate how to retrieve and visualize your music data using a Pluto notebook. Instructions on how to set up Pluto for your system can be found in my previous article. Once set up, open a new notebook or simply use the existing one from here. The package environment can be instantiated using the provided .toml files. This is useful (but not necessary) to maintain reproducibility of the results.
using Pkg
Pkg.activate(pwd())
Pkg.instantiate
To import all the relevant packages in your working environment, execute the following:
using Spotify, DataFrames, VegaLite, Setfield, JSON, Statistics, Query
Getting credentials for API access
In order to use the API, you first need to obtain the proper credentials. This can be done by creating a Spotify developer account. Open your dashboard, and create an app by filling a name and purpose. Then click on “Show Client Secret” to view your secret key. Copy these credentials into your spotify_credentials.ini file, which will be created automatically the first time when you try to use this package. Credentials are only valid for 1 hour. You will therefore need to refresh once they expire, by executing:
Spotify.refresh_spotify_credentials()
The terminal output should show the expiry time, for example:
[ Info: Expires at 2021–10–30T19:37:32.556
Test your credentials
You can test if the API is working correctly by fetching information about an album for example. All objects including albums, tracks, artists etc. have a unique Spotify ID. We use the album_get function along with an album ID and location (= “US”) arguments as shown below:
Requesting personal data
You can request a copy of your personal data from Spotify by doing the following:
- Open Spotify on your desktop browser → Go to Profile → Account
- Open “Privacy settings” from the left pane
- Scroll down to the section “Download your data” and proceed to Step 1
You will receive an email once your data is ready for download. It look ~ 3 days for me. You will receive a collection of JSON files, and we are mainly interested in the streaming data which shows how much time we have spent listening to various tracks.
Retrieve audio features of my playlists
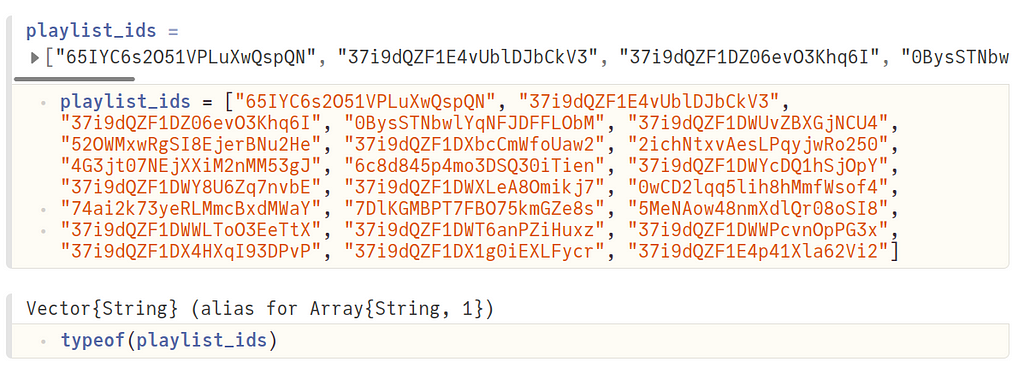
One of the first things I wanted to look at were the audio features of some of my favorite playlists. I gathered the playlist IDs from the Spotify desktop player by opening the playlist and copying the ID (alphanumeric characters) at the end of the URL. I put them all together in an array (type String) as shown below:
Audio features are available for every track, which means we first need to get the track IDs from each playlist. This is done using the function get_playlist_tracks, where we make a HTTP GET request to fetch this information.
This function is not part of Spotify.jl yet (will make a PR soon). The maximum number of tracks returned is 50. As you can imagine, there can be more than 50 tracks in a given playlist. Hence, we need to call this function repeatedly with new offsets (index of the first item to return, default is 0). Finally, we remove the duplicates (same tracks can be present in many playlists), and return an array of track IDs.
Next, we want to fetch the audio features for each track ID. We will make use of the tracks_get_audio_features function from Spotify.jl, and collect all of them in a DataFrame. Details about the audio features can be found here.
The resulting DataFrame df_audio should look like this:
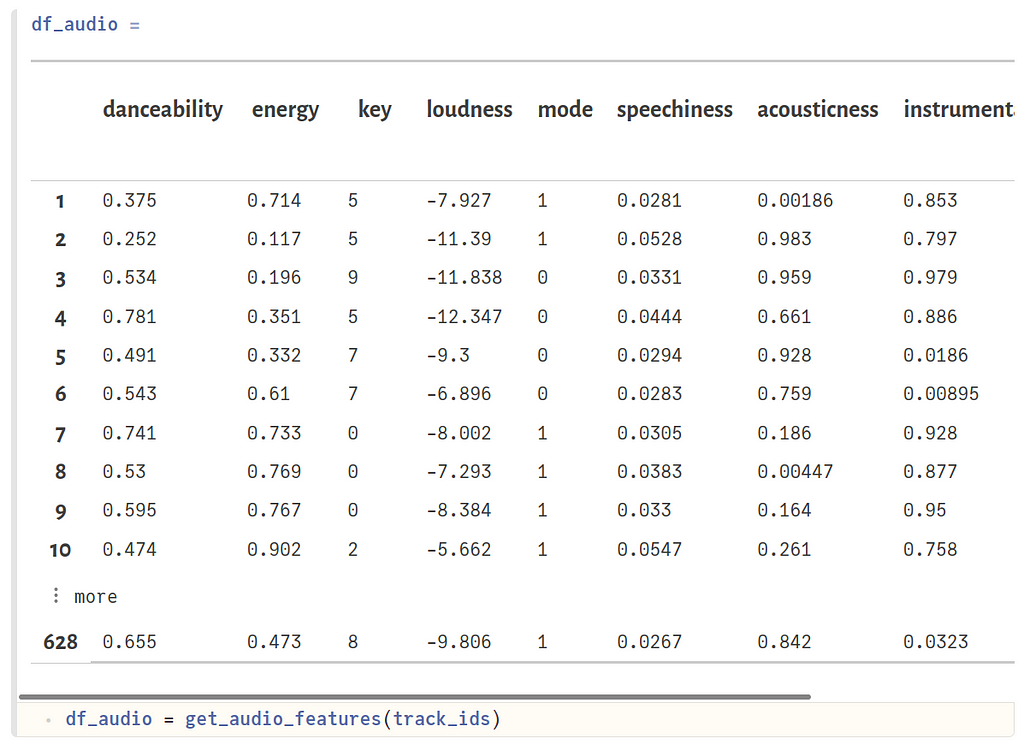
Note that we don’t have features for all the tracks. Either they are unavailable, or we are probably running into API call limits. Anyway, we have enough data to make some nice visualizations.
Plot audio features
We can make a generic plotting function which takes a column name as an argument in order to create a histogram from df_audio.
Now, let’s look at the distribution of various audio features for tracks from my selected playlists.
- First plot shows the distribution of “danceability”. From Spotify’s documentation,
danceability describes how suitable a track is for dancing based on a combination of musical elements including tempo, rhythm stability, beat strength, and overall regularity. A value of 0.0 is least danceable and 1.0 is most danceable.
It seems that majority of my tracks have a high danceability (> 0.5).
- Second plot shows the audio “energy”. Spotify says that…
Energy is a measure from 0.0 to 1.0 and represents a perceptual measure of intensity and activity. Typically, energetic tracks feel fast, loud, and noisy. Perceptual features contributing to this attribute include dynamic range, perceived loudness, timbre, onset rate, and general entropy.
Since I like to listen a lot to relaxing playlists consisting mostly of instrumentals, it makes sense that more tracks have an energy value below 0.5 .
- Third plots shows the audio “speechiness”. As per the documentation,
Speechiness detects the presence of spoken words in a track. The more exclusively speech-like the recording (e.g. talk show, audio book, poetry), the closer to 1.0 the attribute value. Values above 0.66 describe tracks that are probably made entirely of spoken words. Values between 0.33 and 0.66 describe tracks that may contain both music and speech, either in sections or layered, including such cases as rap music. Values below 0.33 most likely represent music and other non-speech-like tracks.
Most of my tracks have a value < 0.2, which is consistent with the fact that I prefer instrumental tracks.
- Last plot shows the audio “valence”.
It’s a measure from 0.0 to 1.0 describing the musical positiveness conveyed by a track. Tracks with high valence sound more positive (e.g. happy, cheerful, euphoric), while tracks with low valence sound more negative (e.g. sad, depressed, angry).
Most of my tracks seem to have a valence value less than 0.5. Does that mean that I am into sad/angry music? I wouldn’t like to think so, many of my relaxing playlists actually help to improve my mood. How does your valence distribution look like? Do let me know in the comments.
Correlation between different audio features
I thought it would be interesting to also look at how correlated audio features are w.r.t. one another. To help quantify that, we can also compute the Pearson’s correlation coefficient, with a value closer to 1 indicating stronger correlation.
Here’s how the various plots look like:
Danceability shows some correlation with energy, which is to be expected since tracks with more energy are usually also quite good for a dance. Tracks with high danceability also tend to be more cheerful and happy. So, the strong correlation with valence can be explained. Similarly, tracks with higher energy could also show stronger correlation with higher valence, which is what we see.
Track duration and popularity data
For each of the tracks, we can obtain additional information such as popularity and duration, using the tracks_get function.
Plotting the DataFrame (df_track) returned from the above function is done similar to previous examples.
Based on the plot above, I think the optimum duration of my preferred tracks is around 3–4 minutes. Regarding the popularity numbers (for artists of the tracks, scale of 0–100 with 100 being most popular), it seems that many of the artists have quite high popularity (> 50).
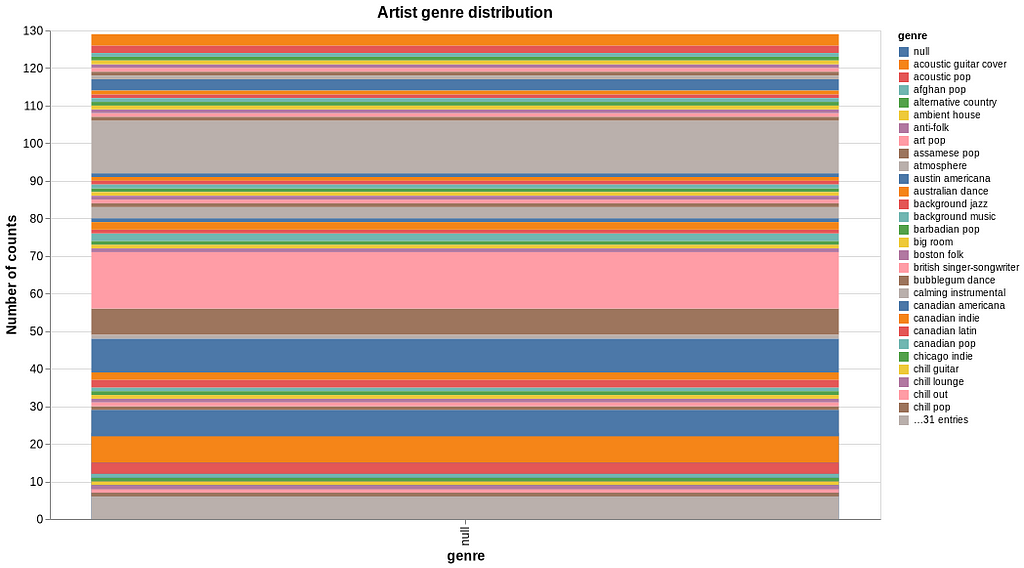
Music genre
The dict returned from tracks_get function also contains the ID of the artist. We can collect all the artist IDs, and then fetch artist data such as the music genre related to them. The relevant code can be found in the Pluto notebook. It seems that “afghan pop”, “art pop” and “atmosphere” are some of the more frequent genres that I have been listening to.
Plot personal streaming data
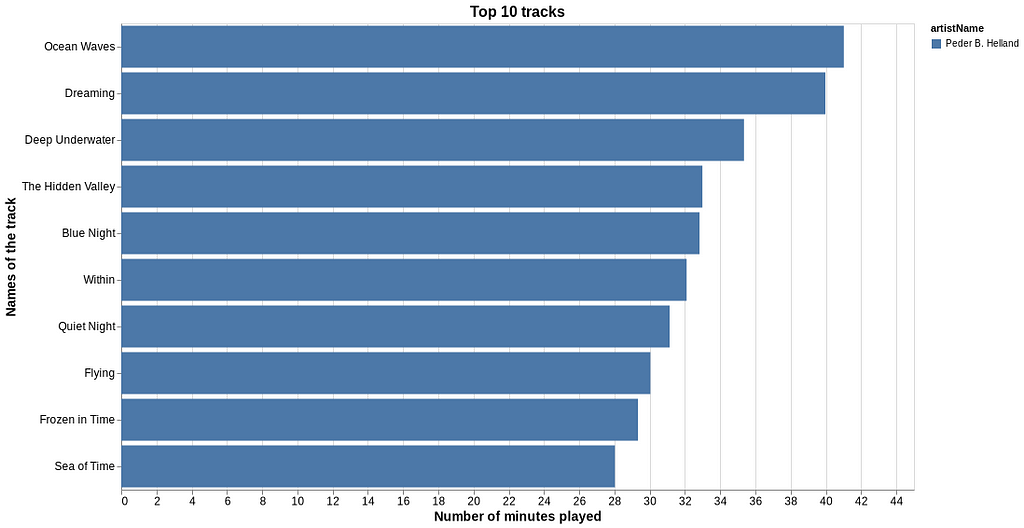
We shouldn’t forget about the personal data (JSON files) that can be requested from Spotify. The files StreamingHistory<>.json can be converted to a DataFrame (df_stream) and sorted w.r.t. minutes played.
We can now look at the top 10 tracks which are essentially the first 10 rows of df_stream.
It would be fun to also get a list of the top artists. That’s some extra work since we now have to combine the streaming time from same artists but with different tracks. So for each of the artists, we filter df_stream and sum the total minutes for the relevant tracks.
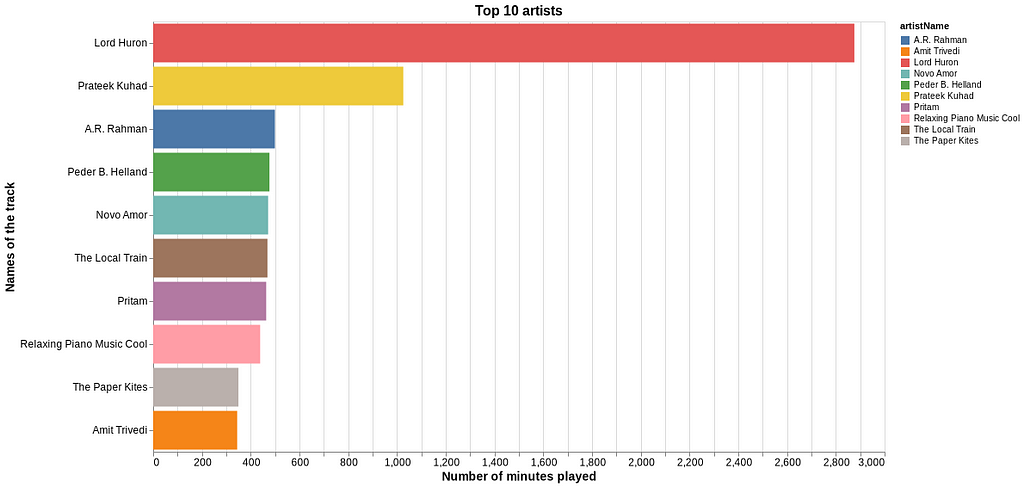
Lord Huron is one of my favorites, and it’s clear that I have been listening to them quite often over the last 1–2 years. Prateek Kuhad is another gem, and of course, A.R. Rahman needs no introduction. “The Local Train” has some great tracks to their credit, and have emerged as one of the best music bands from India.
Conclusion
For Spotify users, there’s a lot that can be learned from their music streaming data. I found the API to be well-documented and quite useful. There are some other interesting endpoints as well, but I will leave them for another discussion. I hope you enjoyed reading this article. Thank you for your time! Full code (Pluto notebook) is available here. In case you want to connect, here’s my LinkedIn.
References
- https://developer.spotify.com/documentation/web-api/quick-start/
- https://github.com/kwehmeyer/Spotify.jl
- https://towardsdatascience.com/visualizing-spotify-data-with-python-tableau-687f2f528cdd
Are Your Playlists Groovy Enough? was originally published in Towards Data Science on Medium, where people are continuing the conversation by highlighting and responding to this story.
from Towards Data Science - Medium https://ift.tt/3mzijxo
via RiYo Analytics


No comments