https://ift.tt/3bMmWhm A probabilistic take on your last Netflix binge An analytical and numerical/simulation analysis on a stochastic pro...
A probabilistic take on your last Netflix binge
An analytical and numerical/simulation analysis on a stochastic process
This article takes an analytical approach to analyzing one of the games featured in the popular recently-released Netflix series, the Squid Game. We will produce statements to describe probabilities involved in the game and will confirm the results using a simulation analysis.
Spoiler Alert:
This article reveals the details of one of some games featured in Netflix’s Squid Game series. I will also talk about the plot in general, which may reveal information you can only learn about after several hours of nail-biting your way through the series. If you are planning to watch Squid Game later, I’d suggest you bookmark this article and return to it only after you have seen it to the end.

Squid Game
As of today, Squid Game remains Netflix’s most watched series of all time. The recently released South Korean television drama features a contest, where 456 players in deep financial crisis play against each other and the house for a chance to win a prize of about ₩45 billion. The contest consists of 6 main deadly games, during which different numbers of players get eliminated and die. We later find out that the prize money and the game is, supposedly, funded through betting amounts placed by the VIPs, a secret group of foreigners who have been wagering on the game and the players.
To make the betting process as exciting as possible for the VIPs, the games are set up such that the players would require a variety of skills and strengths to pass each game. For instance, physical strength and strategy play important roles in game number 3 featuring a tug of war game, where the losing team will fall from a structure erected high above the ground and plummet to their death. Or in game number 1, a game of agility and focus, players need to be fast and have good balance to escape death.
Game Number 5
But perhaps the only game, where the players’ fate is determined entirely by chance and luck is the only determining factor is game number 5, the glass stepping stones. In this game, players need to cross a bridge connecting two platforms elevated high above the ground. The bridge consists of several sections, and each section consists of two glass panels, placed side-by-side. Players need to jump from one section to the next and on each jump they need to hop onto one of the two glass panels, either the one on the right or the one on the left. The two panels look exactly the same. However, one is regular glass and will shatter under the weight of a player sending them to their demise, and the other one is tempered glass, which is stronger and can bear the weight of the player. Each correct hop onto a tempered glass panel, and each elimination reveals the tempered glass of the section to the remaining players. Before the game starts, the players are each assigned a rank in a line through a random process. The rank determines the order, at which they should step on the bridge. In addition to that, all players are collectively given a certain amount of time to cross the bridge, or face annihilation. The game is obviously rigged against the players, who go at the beginning. But are they significantly worse off than the players in the back? This is what we are going to quantify and measure in this article. This YouTube video shows a VR version of the game.
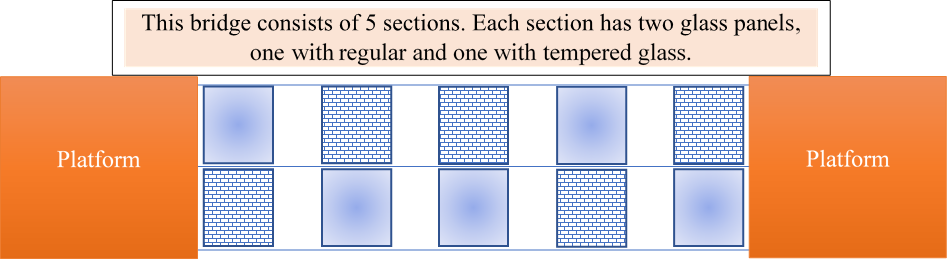
In the actual series, at this point in the games, there are only 16 players left, each randomly assigned a number from 1 to 16, which determines the order for them to step on the bridge. The bridge consists of 18 sections (each section having two glass panels). Any player that crosses all 18 sections successfully without being eliminated walks onto the platform and is saved (for now!).
Analysis
I came across a Python simulation calculating the probability of survival for each player, which I found very interesting. I also wrote my little Python simulation and acquired similar results (see the next section). However, I decided to model the probabilities analytically to generate closed-form expressions for each probability of survival so that the probabilities can be calculated for any number of players and sections. Before we being, let’s put together our assumptions list.
Assumptions: I am assuming that,
- once the tempered glass at a step is identified, it will be remembered by all players who are yet to get to that step.
- nothing other than stepping on a glass panel reveals if it is regular glass or is tempered.
- players proceed based on their rank without ever stepping onto a panel where another player is standing.
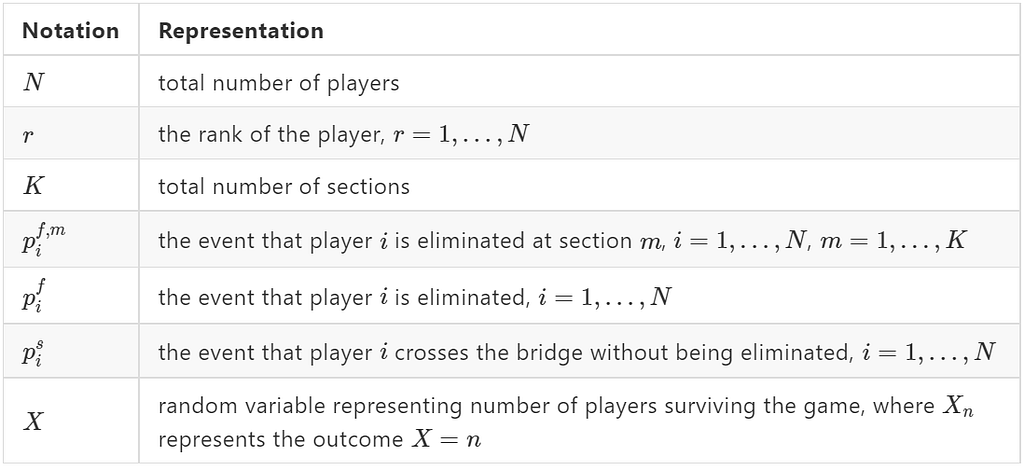
Notations: Here are the notations I used to model the probabilities.
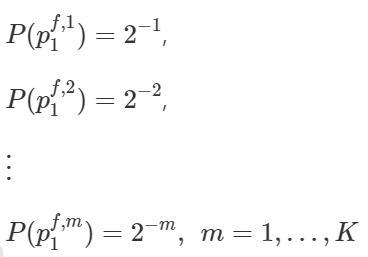
Starting with the unlucky player who will be stepping on the bridge first, player number 1. Let’s find her probability of survival and the probability that she gets eliminated in any of the stages.
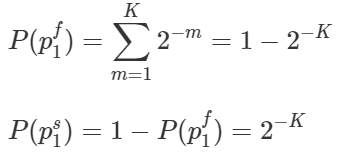
This means, for player 1, the probability of being eliminated, and that of crossing the bridge safely will be,
For player 2, the probability of being eliminated in stage m is a conditional probability.
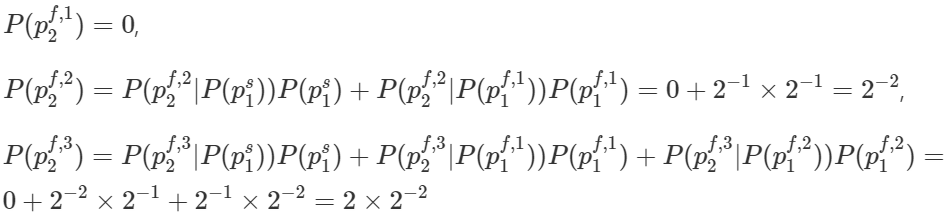
By induction, we can derive the following general statement for player 2.
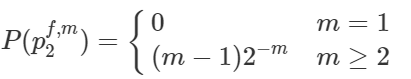
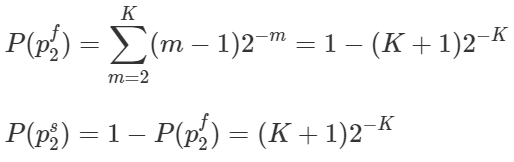
This means, for player 2, the probability of being eliminated, and that of crossing the bridge safely will be,
Using conditional probabilities, and by induction we can find that the probability of being eliminated at stage k for players 3 and 4 as follows.
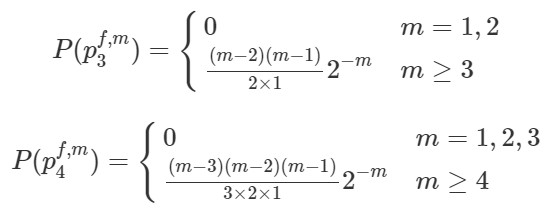
By induction, we can find the probability that player rank r will be eliminated at stage m as follows. Based on that, the probability that player r is eliminated at any stage, and the probability that player r makes it to the other platform safely can be derived.
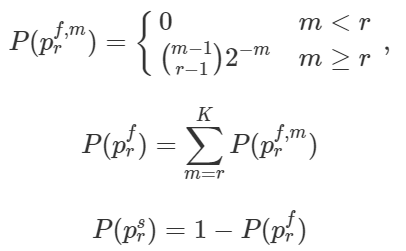
Proof: The above statement can be easily proved by induction, where the probability for r=K-1 is assumed and based on that the probability for r=K is derived, which will prove the statement. The general gist of the proof is along the lines of, for player r to fail at section m (with m being at least equal to r), we need to have all r-1 players to have failed somewhere along the m-1 stages. There are (m-1)C(r-1) (the binomial coefficient) scenarios for that to happen and the probability of each scenario is 2 raised to -m. Contact me for the detailed proof!
Based on the results above, the probability of player r failing at any stage, and successfully crossing the bridge will be,

The 2F1(a,b;c;z) function is the Hypergoemetric Function, which is a special form of the generalized hypergeometric function, described below,
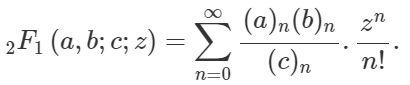
To learn more about the Hypergoemetric Function see this link.
Number of Survivors
I can imagine that the expected number of survivals must have played a role when the organizers were setting up the game for the VIPs. Let us define the discrete random variable X to represent the number of players that survive the game in each round of play. To find the E(X) we need to figure out its probability mass function. For the game with N=16 and K=18, it can be derived that,
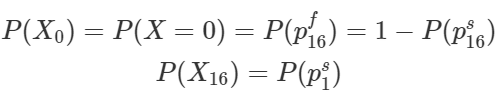
For the probability of other outcomes of X, let’s review it for the outcomes X=1 and X=2, and then we will generalize it.
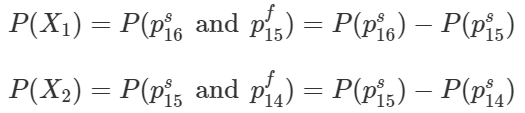
In general, we can say,
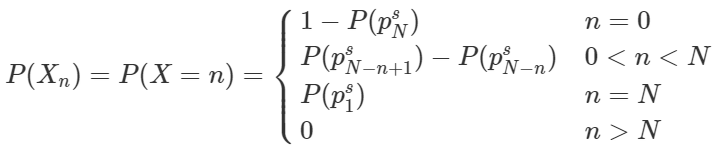
Proof: The proof can be structured by induction. In general, the probabilities for X=0, X=N and X>N are self-explanatory. For the remaining option, it is beneficial to remember that the event player k surviving is a subset of the event player k+1 surviving, and also that the event player k+1 being eliminated is the subset of the event player k being eliminated. Using the sample space and the probability of events, you can derive the above.
The expected number of surviving players will then be,
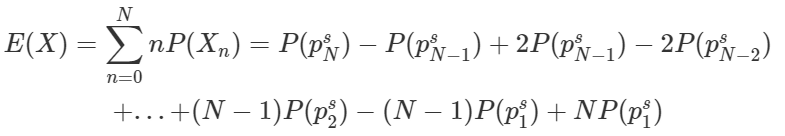
which simplifies to,
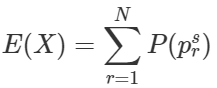
In other words, the expected number of surviving players is the sum of probabilities of success for all players. In the next section, we will present the numerical analysis of the results above.
Numerical Analysis
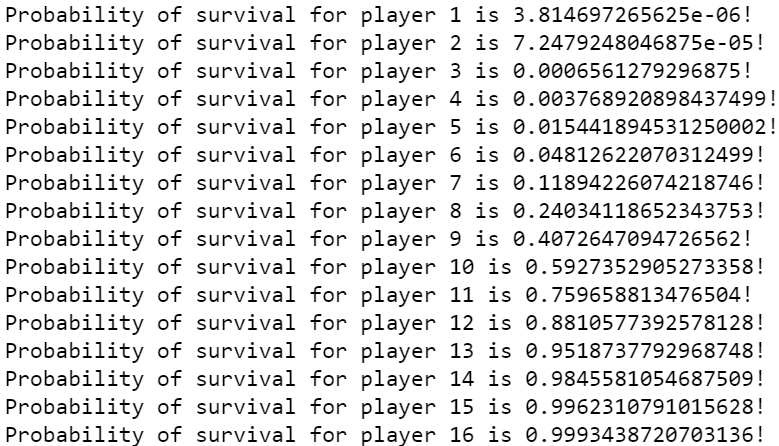
Based on the closed-form expressions above, we can find the probabilities of survival for each of the players, where there were 16 players and the bridge had K=18 stages. The Python script is presented below.
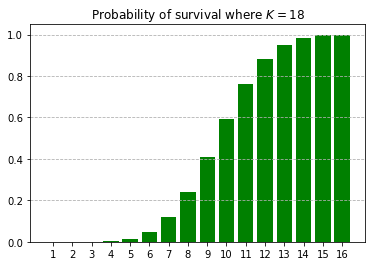
The results for each player when there are K=18 sections are presented below. Yes, the players at the front are significantly worse off than the players in the back. The probability of survival for the last 4 players is higher than 90%.
Here is the visualization for the probability of survival for each of the 16 players, when K=18.
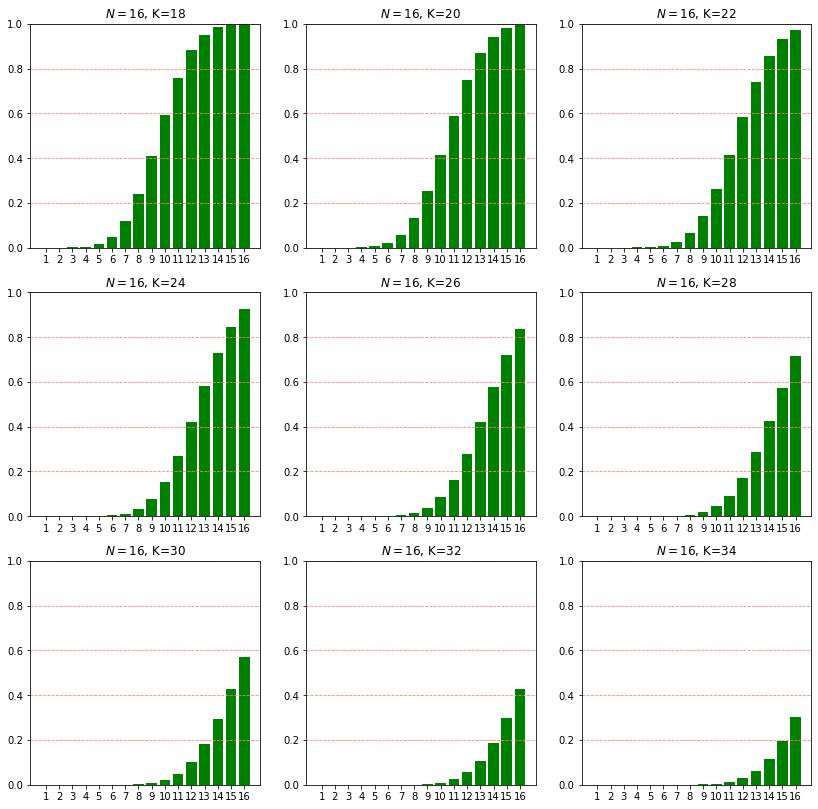
Below you see the same visualization for the probability of survival when there are 16 players (N=16), but for different number of sections (K). Notice how the probabilities quickly drop as more sections are added to the bridge.
For this particular game with N=16 and K=18 (16 players and 18 sections) the following is the probability mass function for the random variable X, representing the number of surviving players.

We can see that the mode is at X=7 representing 7 players surviving with probability of approximately 0.185. Perhaps not surprisingly (note the symmetry), the expected number of surviving players for this particular game is also approximately 7, or to be exact E(X)=7.000076294. If the VIPs expected a number around 7 for surviving players, they must have been unpleasantly surprised to observe that only 3 players survived Game 5.
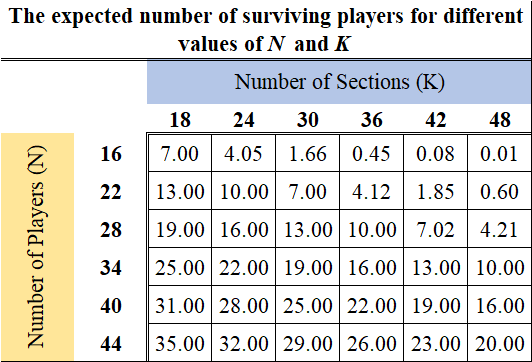
The table below presents the value for E(X) for different scenarios with different values for number of players and sections (N and K).
The following visualizes the trend for expected value of surviving players (E(X)) for different values of N and K.
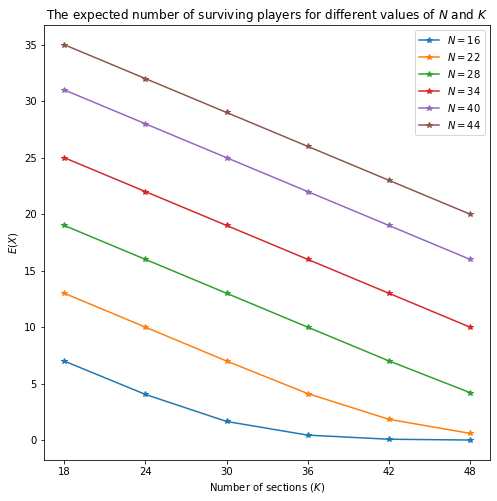
Observing the plot, we can see that for any given number of players, increasing the number of stages will decrease the expected number of surviving players. As expected, for the same number of sections, more players means a higher expected number of surviving players.
Simulation of Survival
With large enough number of iterations, we can also create a simulation with different values of N and K to find the probability of survival for players as well as expected value for the number of surviving players. Below is a simple function I wrote to find the probability of survival for each player.
After running the function for 16 players, 18 sections and with 1,000,000 iterations (rounds of play), my calculated probabilities of survival for the 16 players were found to be almost identical to the results I derived analytically.
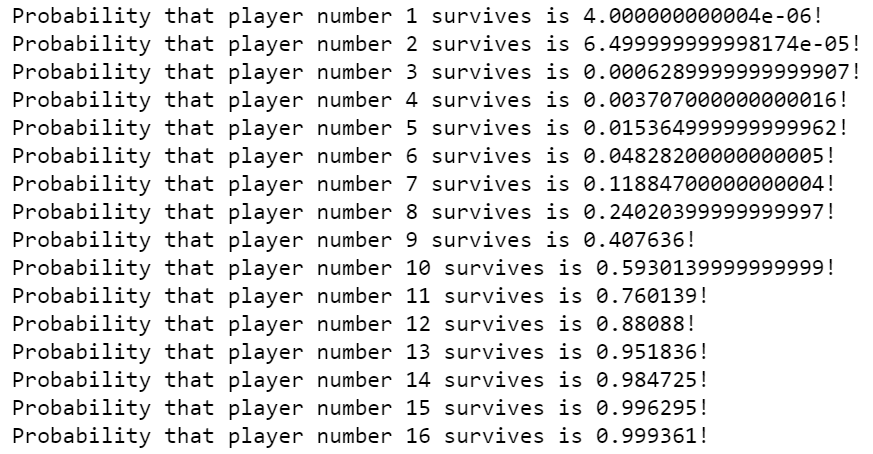
I simulated the expected number of survivors for the case N=16 and K=18 only. The results is very close to my analytical results above. My simulation of 1,000,000 replications resulted in an expected number of 6.997991 survivors, while the analytical results gave 7.000076294. I did not simulate finding the expected number of surviving players for other values of N and K, but I imagine they should be pretty close as well.
Analytical Results vs. Simulation
We derived analytical results for the probabilities for survival and the expected number of survivors for different values of N (number of players) and K (number of stages). We also confirmed those results using a numerical/simulation analysis. But which method is more efficient/effective?
In general, analytical results are often preferred to results derived by simulation. Analytical results are particularly useful as they provide versatility, computation speed and efficiency in analysis. In addition to those, analytical results lend themselves quite well to producing numerical results and sensitivity analyses. However, closed-form expressions are not always available or easily derived. In those cases, simulations can present results that are reasonably accurate. In this particular model, it was relatively easy to derive analytical results. However, if more complexity was added to the system in the form of random events or complex interactions between players, it would become increasingly more difficult to derive closed-form probabilistic expressions to capture survival probabilities and expected values. In those cases, simulation can help us achieve results much more easily.
A Probabilistic take on your last Netflix binge was originally published in Towards Data Science on Medium, where people are continuing the conversation by highlighting and responding to this story.
from Towards Data Science - Medium https://ift.tt/3q3rGrv
via RiYo Analytics


No comments