https://ift.tt/3rhxHBu Statistical Power in A/B testing visualized In Data Science, we often need to run A/B tests and interpret the resul...
Statistical Power in A/B testing visualized
In Data Science, we often need to run A/B tests and interpret the results using statistical power. In the blog, I will explain what power is and how to increase power using visualization.
Before we start, I’m assuming you have some basic knowledge about:
What is Power
In a binary hypothesis test, either the null hypothesis H0 is true, or the alternative hypothesis HA is true. Typically, we set the null as not having any effect or things staying the same, such as two means being the same (mu1 = mu2). And we set the alternative hypothesis as having some sort of effect or things change after you introduce a variable into the experiment, such as two means are not the same (mu1 ≠ mu2).
And for us testers, we don’t want H0 to be true. We don’t want to go through all the trouble implementing tests only to find out the variables we introduced are useless. Instead, we care about HA being true because we want to find significant variables, so we need to care about the probability that we are right: the probability that we reject H0 and therefore accept HA when HA is indeed true. And that is called statistical power, your ability to detect an effect when it is there.
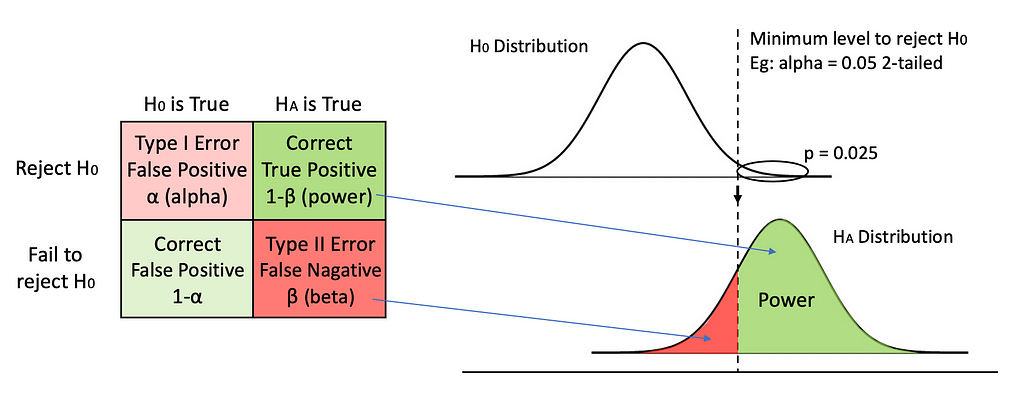
In this graph, we visualize power in darker green. In a hypothesis test, we always determine the alpha value beforehand, which is usually set at 0.05, so the Type I error rate is set in stone before we even begin the test. Then, we can calculate the minimum critical value we need to reject H0. We can draw a line from the null hypothesis distribution down to the alternative hypothesis distribution and separate the area under curve into two pieces. If our calculated t or z value falls on the left of the dashed line, we fail to reject H0 when HA is true and we make a Type II error. If the calculated value falls on the right, we reject H0 when HA is true and we make the right call. Therefore, the area on the right of the curve is our power.
Please note that we only talk about power when HA is true. If unfortunately, H0 is true and there is no effect whatsoever, no amount of power is going to help us. As you can see in the graph, when H0 is true, we deal with alpha only. But in real life, we have no idea if H0 or HA is true and we cannot change the ground truth. All we can control is to reject or not reject H0 while hoping HA is true. Despite that, we still want to increase our statistical power, so that we have the best chance of detecting an effect when it is indeed there.
How to Increase Power
Let’s take a closer look at the visualization and understand what kind of information we know in the graph.
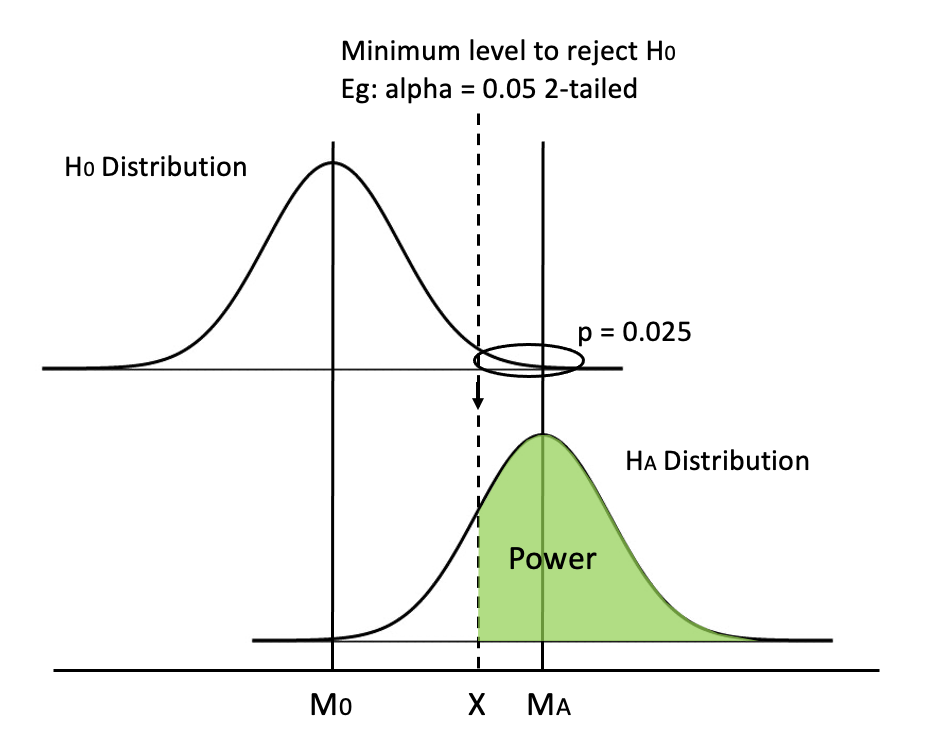
We know before start: (1) alpha level, (2) whether we use a 1-tailed or a 2-tailed test, (3) shape of the distribution (t or z).
After doing the test, we know: (4) sample size, (5) means of the distributions M0 and MA (or the difference between them), (6) standard deviation of the distributions and therefore (7) standard error (SE) and (8) min critical value, aka the value of dashed line X (using M0, min critical value and SE)
An example can be testing if doing every SAT question in a practice book actually makes a difference. The population mean for SAT is M0 = 500 and population SD = 100. Since we know the population mean, we can use a z distribution. We can set the test as 2-tailed (alpha = 0.05) as usual. Now, we do our test and check the test data. Let’s say N = 100, mean for the HA distribution is MA = 530. Since we assume the two distributions are the same, we can calculate that SE = SD/√N = 100/√100 = 10 and therefore X = z_crit * SE + M0 = 1.96 (we know that from a z table) * 10 + 500 = 519.6. Okay, now we are finally ready to calculate the power. The critical value for HA distribution is z_crit2 = (X-MA )/SE = (519.6-530)/10 = -1.04. We can check the z table and see that the corresponding p(x ≤ -1.04) = 0.1492, so the power is 1-0.1492 = 0.8508.
Now knowing so much information on this graph, how do we increase power?
I believe it’s easier to think visually. How would you increase the area in green? We can shift the dashed line (method 0 & 1), move the mean MA (method 2), or change the shape of the distribution (method 3–5).
0. Raise significance level alpha (the WRONG way)
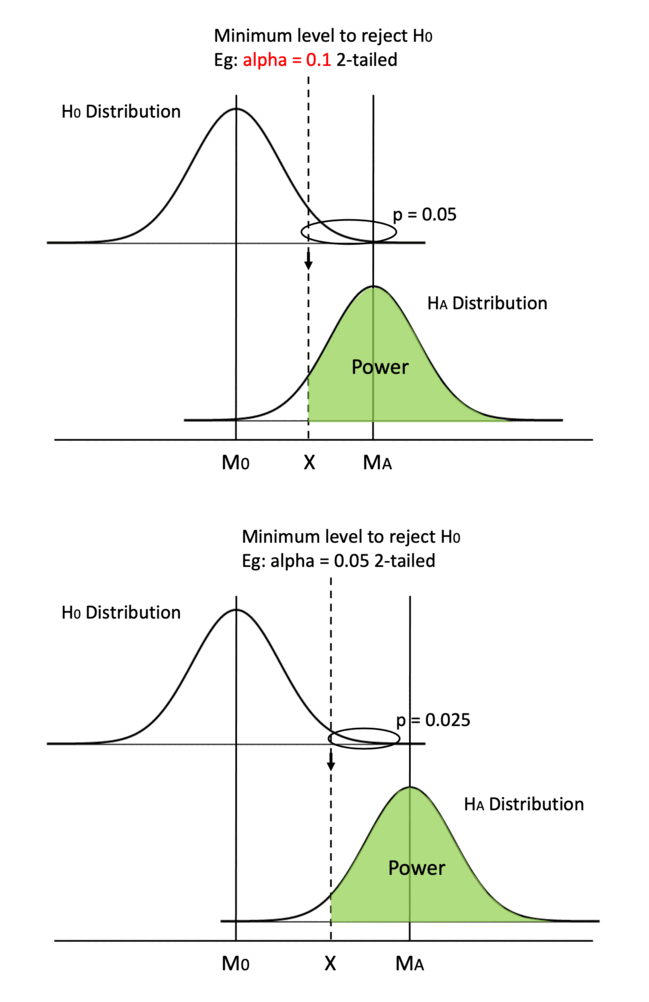
Keeping everything else in place, one straightforward method is moving the dashed line to the left. By increasing alpha or switching from a 2-tailed test to a 1-tailed test, we can decrease the min critical value X.
Easy peasy, but one big caveat is that increasing alpha is going to result in a higher probability of making a type I error, so we never tamper with the value of alpha.
1. Switch from a 2-tailed test to a 1-tailed test
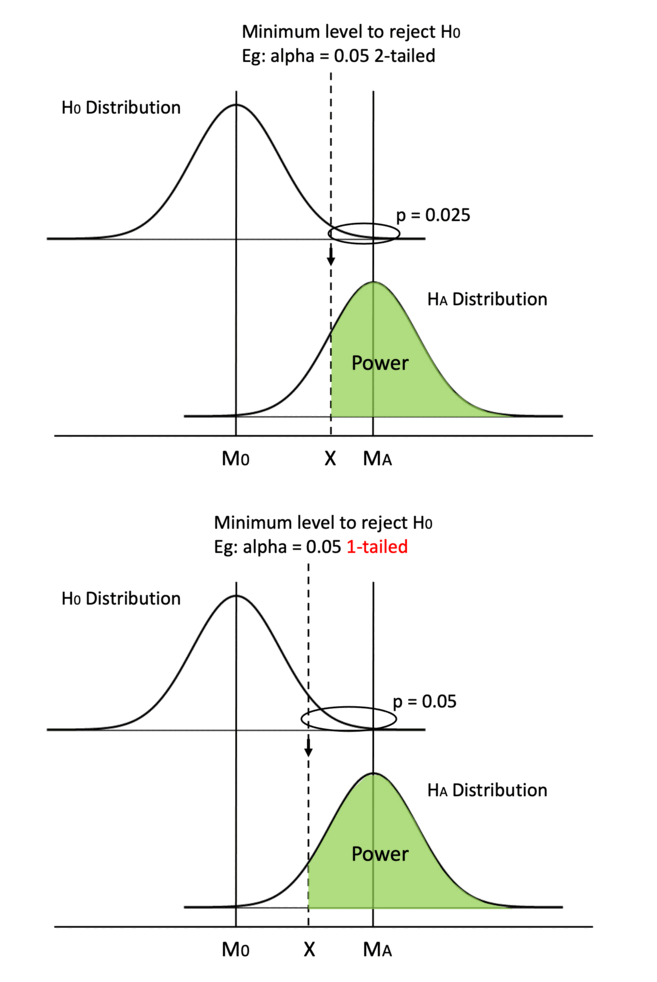
Similarly, switching from a 2-tailed test to a 1-tailed test can move the dashed line to the left.
Whether we use a 2-tailed or a 1-tailed test depends on our test design and is set before running the experiment, so we need to keep in mind from the beginning to favor a 1-tailed test.
2. Increase mean difference
Another way is to increase the difference between the two means. Since the H0 distribution is fixed because the null hypothesis generally doesn’t change, we can only hope that the HA distribution can shift to the right.
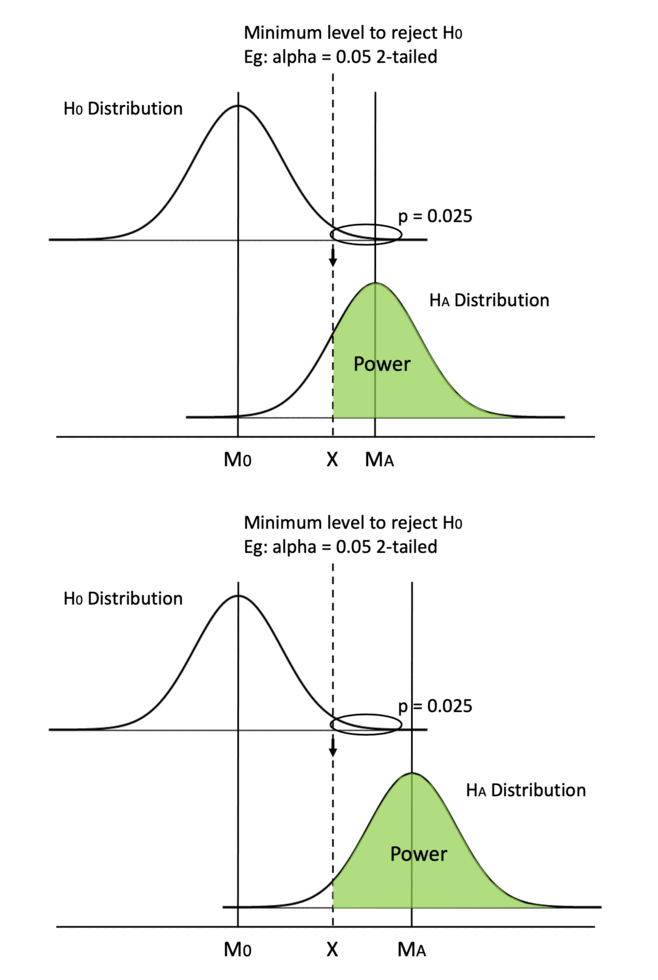
However, we cannot manually achieve that. We need to report the distribution we get from the test data as it is (otherwise, it is data manipulation!). But this quantifies why we like a bigger mean difference, in that it gives us more power.
Note: Mean difference is an effect size, so we can say increasing the effect size can increase power.
3. Use z distribution instead of t distribution
Starting from this method, we focus on modifying the shape of the distributions. Using a z distribution will make it easier to reach statistical significance. Why?
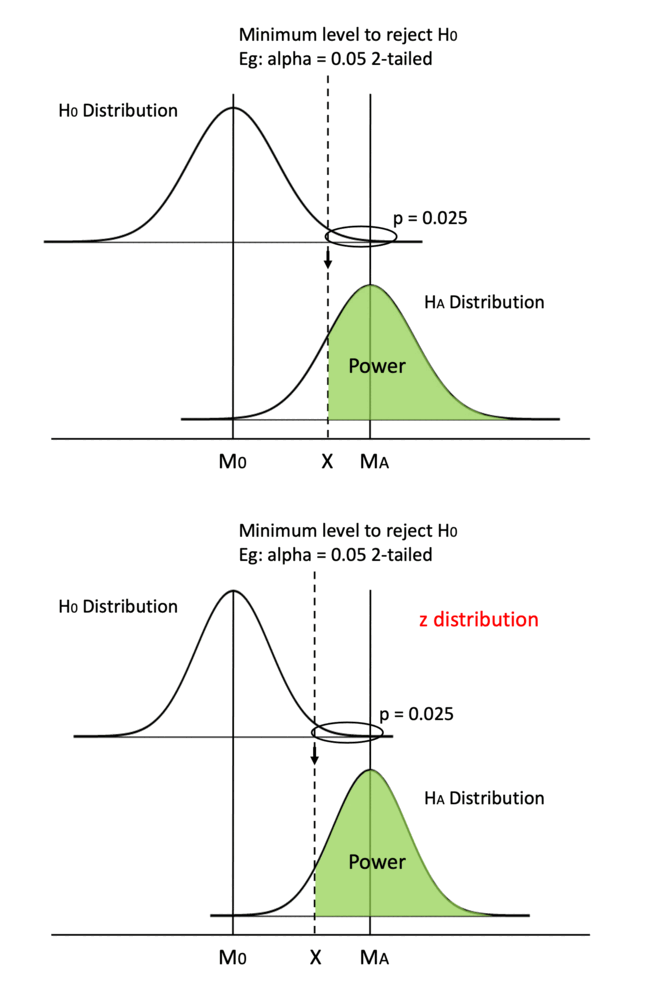
Because a z distribution has a larger kurtosis (z is taller than t distribution) and has thinner tails. By changing the shape, X decreases as well, so the two effects increase power. In the previous example of the SAT score, using z distribution is appropriate because we know the population mean. Although this does not happen often in real life, we can use z to approximate a t distribution when the sample size is large.
This change in shape is not going to be very significant though. I exaggerated a bit in the GIF so that it is easier to see.
4. Decrease standard deviation
Another method to modify the shape of the distribution is to reduce SE by decreasing SD.
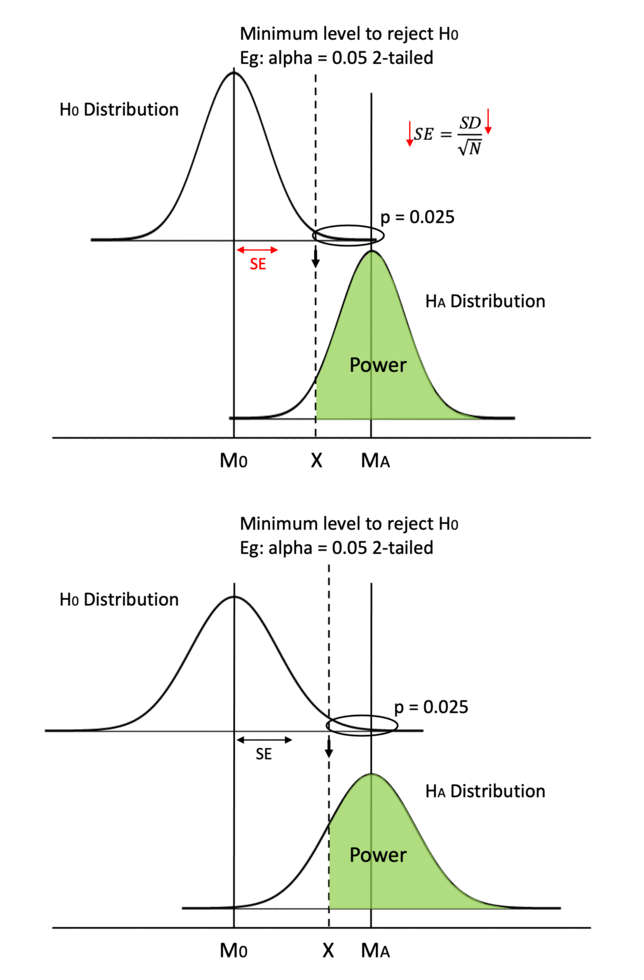
We can use more precise measurements like asking clear questions instead of vague ones in user feedback surveys. That way, our data is going to have less error and less noise.
Also, we can try to run a paired samples t-test if it applies. The gist of why it works is that paired groups have a higher correlation and the difference in scores between paired samples are smaller.
5. Increase sample size (the most practical way)
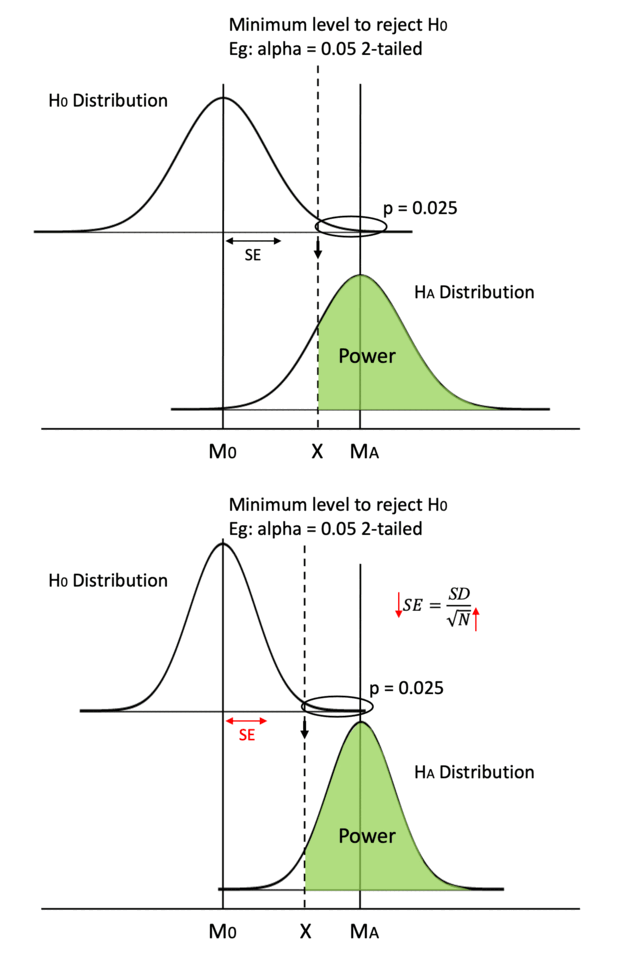
Finally, the one method we can always rely on is increasing sample size. If SD remains the same, an bigger sample size N increases the denominator, then SE will decrease.
This is also the most practical way in real business scenarios. It is much easier to collect data from more users or send out more surveys than following the methods listed above.
Conclusion
In this post, we talked about what statistical power is using visualization, went through an example to understand the graph better, and talked about 5 ways (6 ways really) to increase power:
- Raise significance level alpha (the WRONG way)
- Switch from a 2-tailed test to a 1-tailed test
- Increase mean difference
- Use z distribution instead of t distribution
- Decrease standard deviation (by using precise measurements & paired samples t-test)
- Increase sample size (the most practical way)
Thank you for reading! I hope this blog has been helpful to you.
5 ways to Increase Statistical Power was originally published in Towards Data Science on Medium, where people are continuing the conversation by highlighting and responding to this story.
from Towards Data Science - Medium https://ift.tt/3FY2Lu9
via RiYo Analytics

ليست هناك تعليقات